
Ethnic food demand moves beyond immigrant households
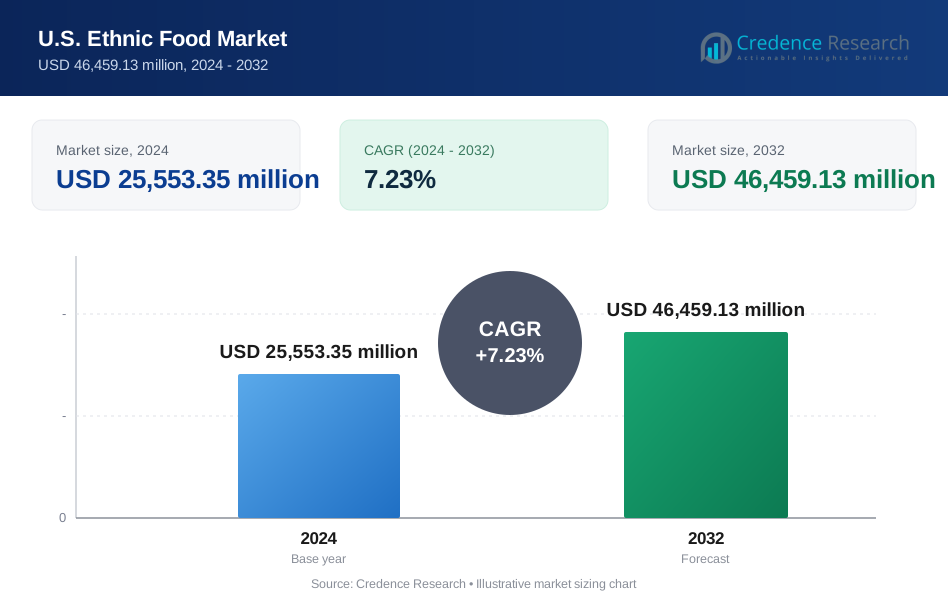
The U.S. ethnic food market was valued at USD 27.40 billion in 2025 and is projected to increase from USD 29.38 billion in 2026 to USD 55.07 billion by 2035, registering a CAGR of 7.23% during 2026–2035. Demand comes from Hispanic and Asian households that buy cuisine staples weekly and from mainstream home cooks who now treat global dishes as ordinary dinners. The West held the largest regional share, 34.0% in 2025, because California anchors both Mexican and Asian restaurant supply. The South is the fastest-growing region at 7.7% a year, helped by population gains in Texas and Florida. Latin American cuisine remains the largest type, while Korean noodles and frozen dumplings supply much of the new growth. The main commercial change is a move toward domestic production, shown by the large Asian food plant under construction in Sioux Falls, South Dakota, which is due in 2027. Import duties have changed repeatedly since 2025, so local manufacturing now matters to margins as well as to supply.
What counts as ethnic food in this market, and what are the main categories?
The market counts packaged foods, ingredients and prepared meals from or inspired by specific cuisines, sold through grocery, specialty and online retail and supplied to foodservice operators. The main categories are Latin American, Chinese, Japanese, Korean and Other Asian, Southeast Asian, Indian, Mediterranean and Middle Eastern, and African and Afro-Caribbean foods, across frozen meals, sauces, spices, rice, noodles, snacks, pulses, soups and beverages.
The value excludes restaurant menu sales, delivery fees, catering and unbranded fresh produce or raw meat. Foodservice therefore means ingredient and product supply to restaurants, not the check a diner pays. The value chain runs from importers and domestic manufacturers through specialist distributors and national brokers to supermarkets, specialty grocers, shopping apps and independent restaurants.
U.S. Ethnic Food Market Insights
- The market grows from USD 27.40 billion in 2025 to USD 55.07 billion by 2035, a 7.23% annual rate that rests on both immigrant households and mainstream cooks.
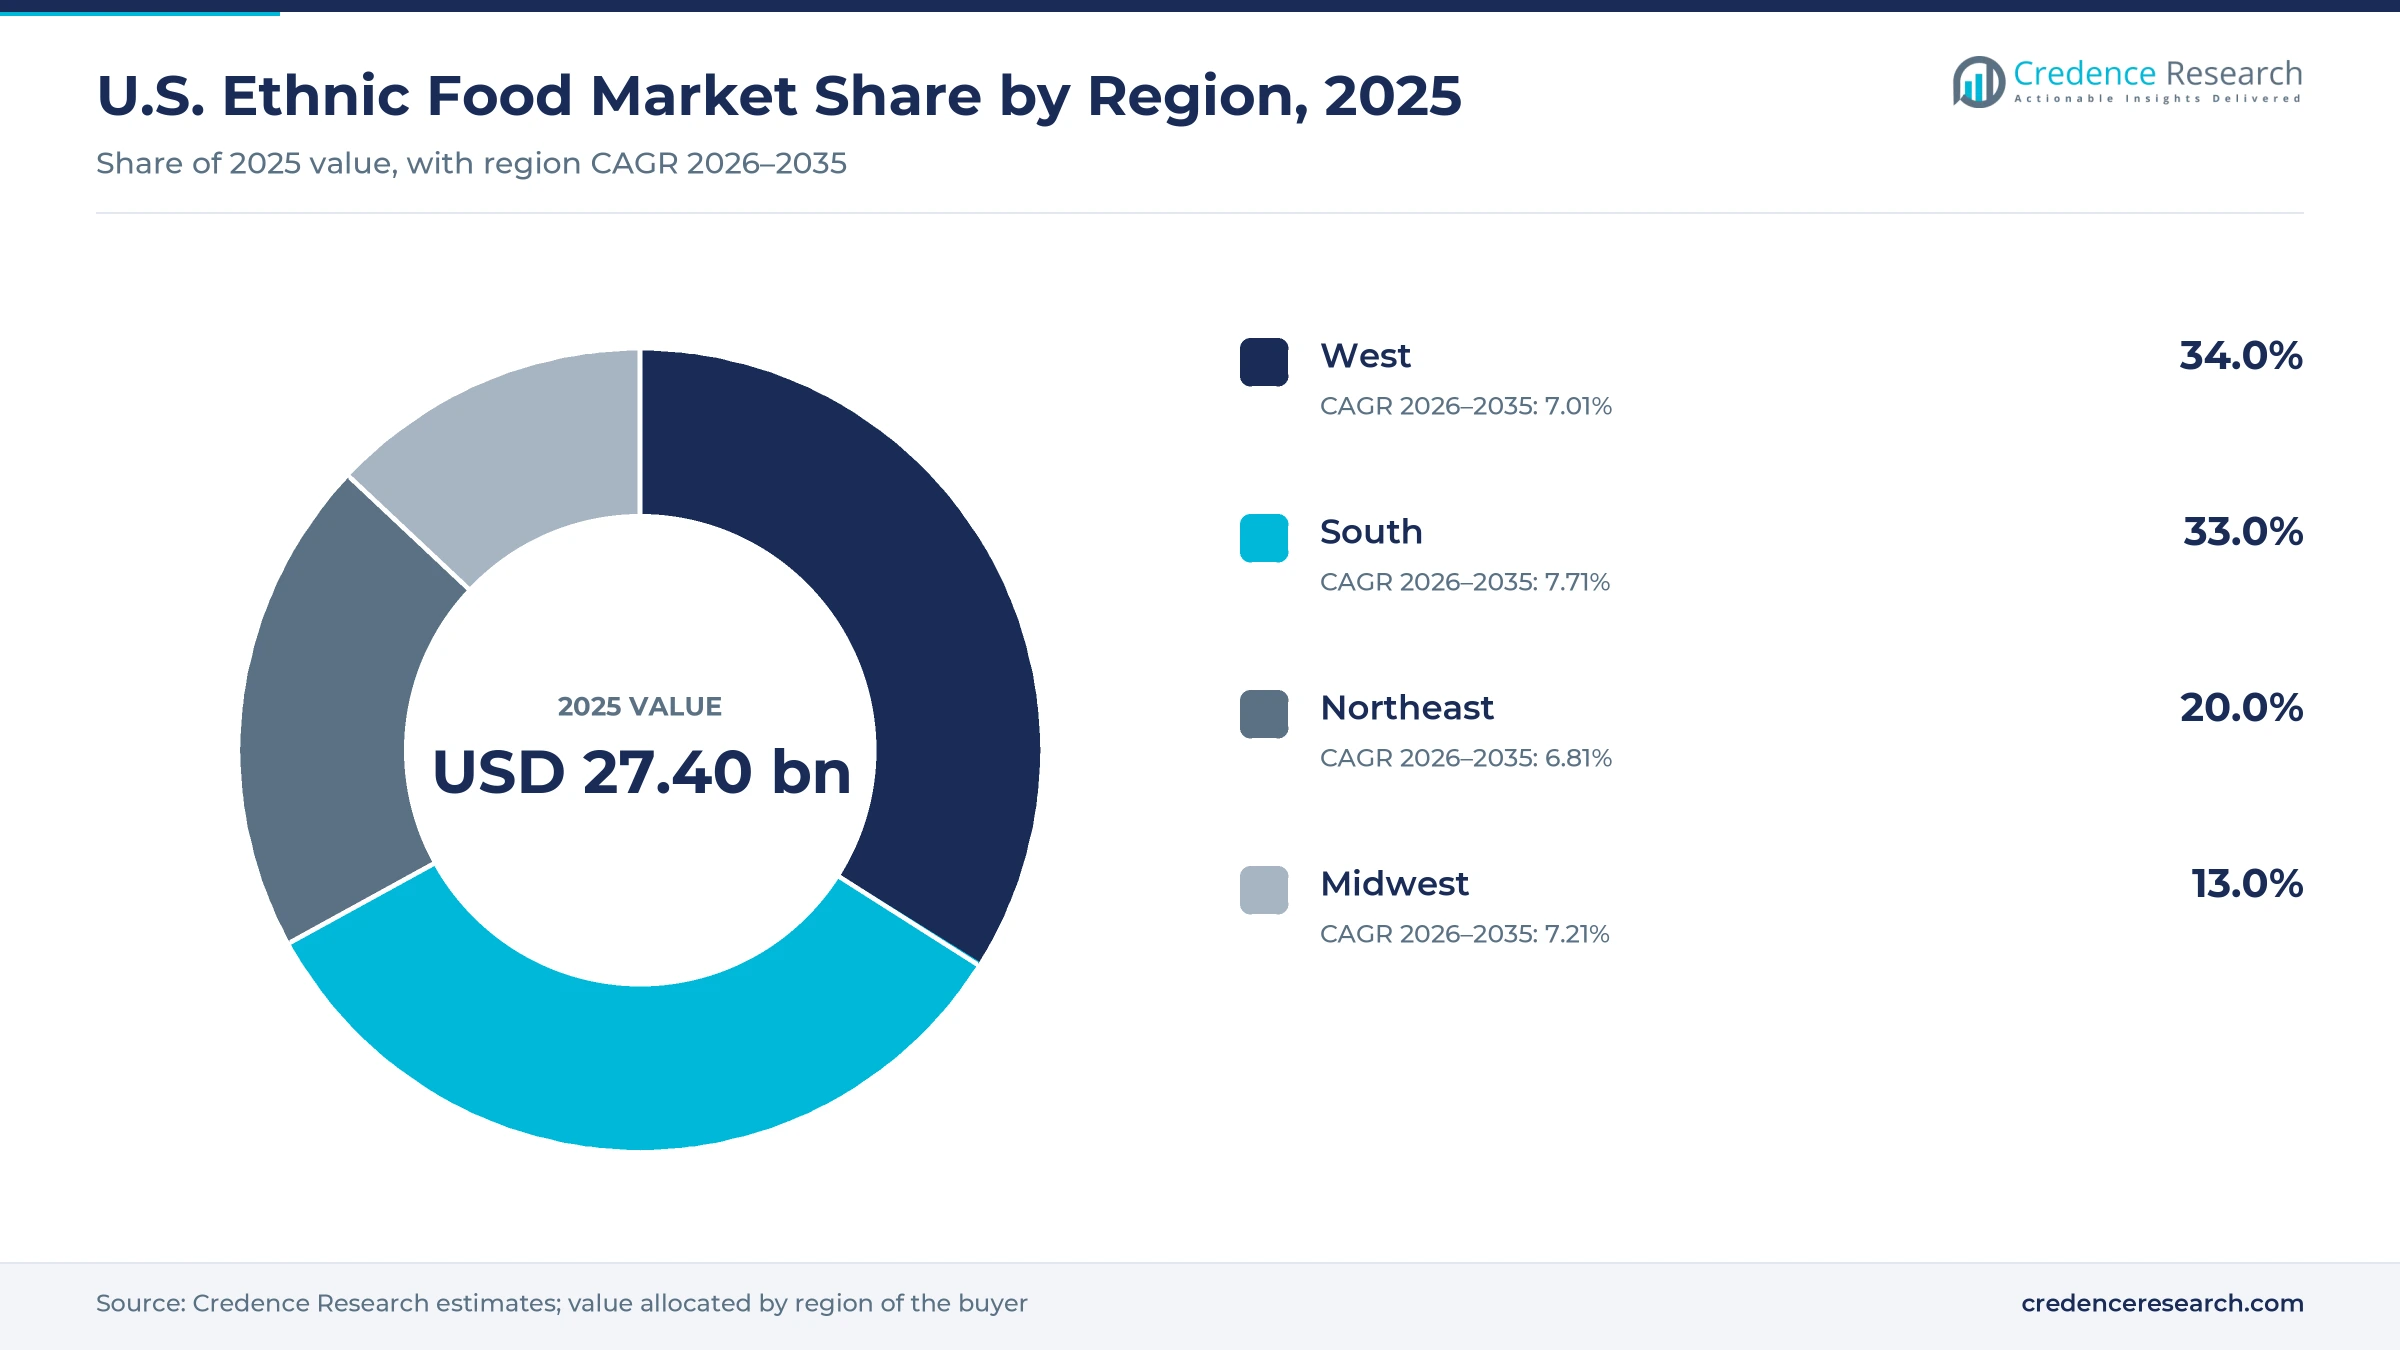
- The West held 34.0% of 2025 value, supported by California, which accounts for 22% of the nation's Mexican restaurants according to Pew Research Center.
- Latin American cuisine held 38.0% of 2025 value, anchored by a Hispanic population of about 68 million residents on July 1, 2024.
- Production is moving onshore, with CJ CheilJedang breaking ground on Nov. 13, 2024, on a Sioux Falls plant that is due to be complete in 2027.
- Competition spans heritage brands such as Goya Foods, Korean groups, national grocers and online specialists, while duty rules changed again on July 24, 2026.
Latin staples lead while Korean and frozen lines climb
Which cuisine types lead, and which is growing fastest?
Based on type, the market is categorized into Latin American, Chinese, Japanese, Korean and other Asian, Southeast Asian, Indian, Mediterranean and Middle Eastern, African and Afro-Caribbean, and other cuisines. Latin American led with 38.0% of 2025 value because Hispanic households buy these staples weekly, and Pew Research Center found in 2024 that 11% of U.S. restaurants serve Mexican food. Japanese, Korean and Other Asian grows fastest at 8.7% a year as Korea Customs Service data showed ramyeon exports to the United States rising 18.1% to USD 255 million in 2025. Among Asian restaurants, Pew counted Chinese at 39% and Japanese at 28%.
Why do frozen foods lead the product mix?
Based on product, the market is categorized into frozen ethnic food, sauces and condiments, rice, noodles, spices and herbs, snacks, pulses and soups, beverages and other products. Frozen Ethnic Food led with 24.0% of 2025 value because takeout-style frozen items reached USD 14.3 billion in annual sales across all frozen takeout-style items, only part of which falls in this market, according to Conagra Brands in January 2026. Noodles grow fastest at 8.4% a year as Korea Customs Service data showed ramyeon exports to the United States up 18.1% to USD 255 million in 2025. In sauces and condiments, MegaMex Foods added a Herdez al pastor entree in April 2025.
How does storage shape what stores can carry?
Based on storage type, the market is categorized into ambient shelf stable, frozen and fresh and chilled products. Ambient Shelf Stable led with 52.0% of 2025 value because rice, beans, spices and sauces travel long distances and sit in pantries, and USDA data cited by Dawn in August 2025 show that imports exceed 25% of the domestic rice market. Frozen grows fastest at 7.9% a year as new capacity arrives, including a 700,000-square-foot Sioux Falls building described by FoodNavigator in June 2024. Chilled lines remain narrower, yet hummus alone is close to USD 1 billion in category sales.
Where do shoppers and restaurants buy these foods?
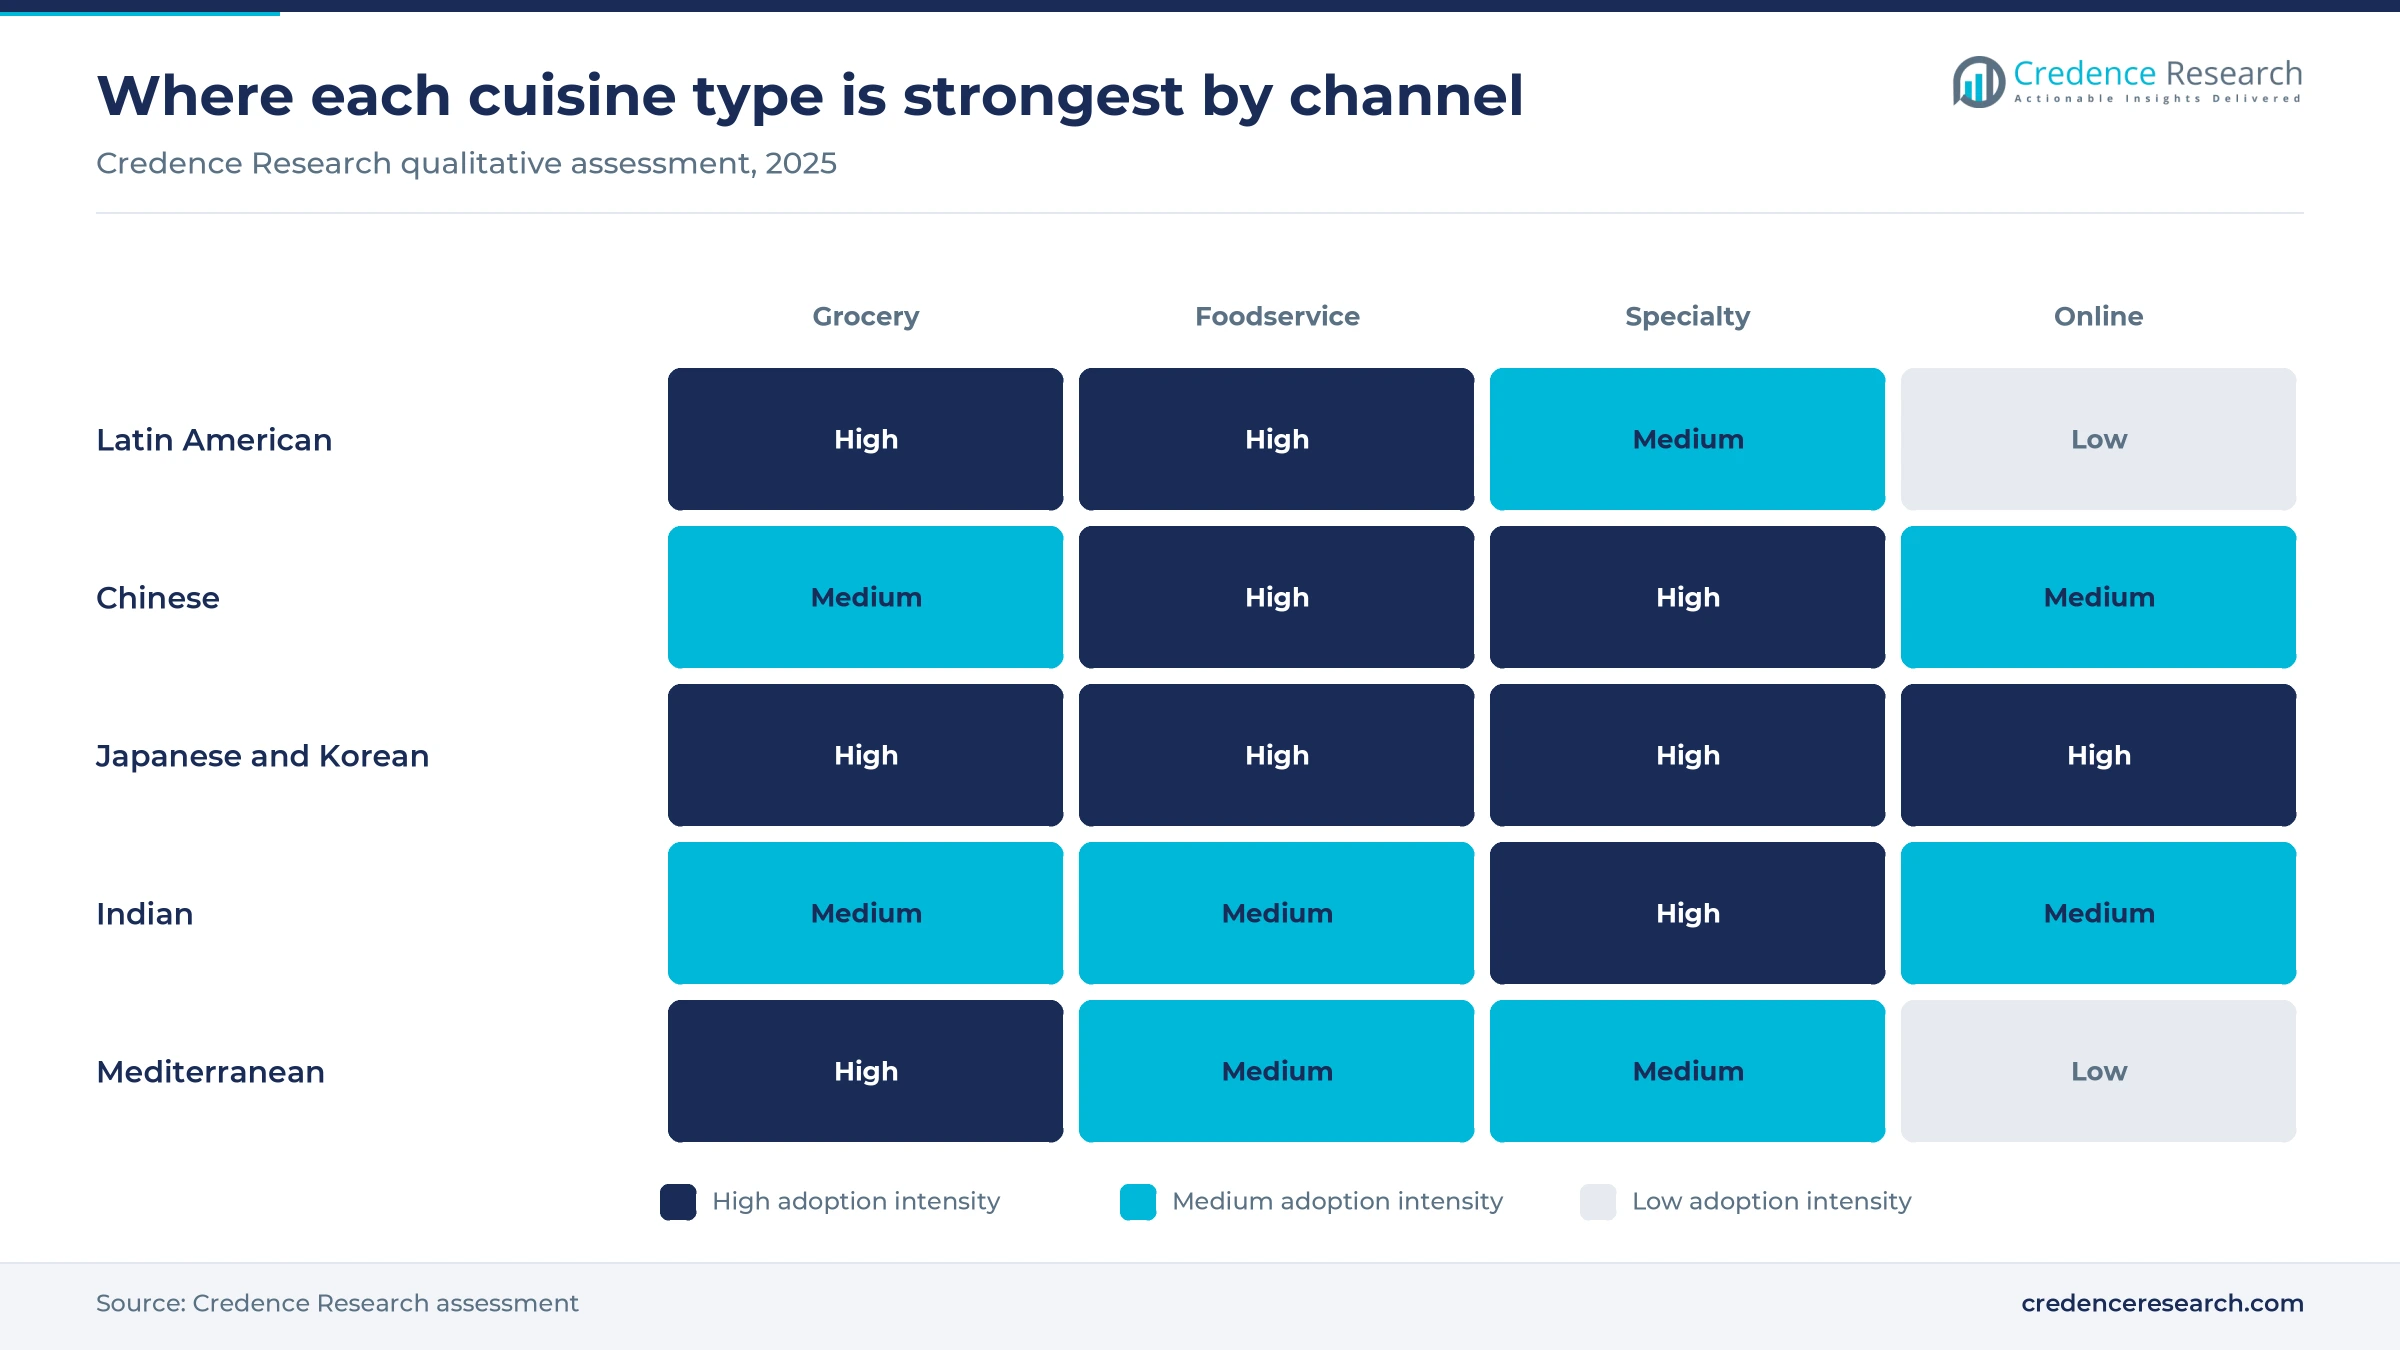
Based on distribution channel, the market is categorized into grocery (super/hyper), foodservice, specialty and pure online. Grocery (Super/Hyper) led with 47.0% of 2025 value because mainstream chains such as Whole Foods, Target and Trader Joe's now stock Asian grocery items, according to Adweek in October 2026. Pure Online grows fastest at 10.2% a year as Weee! served 1.5 million buyers in 2025 across more than 300,000 goods, according to the South China Morning Post. Foodservice supply depends on specialists, and specialty grocers keep winning trips with live seafood, food halls and fresh prepared counters.
| Segment Group | Leading Sub-segment | Share, 2025 | Fastest-growing Sub-segment | CAGR, 2026–2035 |
|---|---|---|---|---|
| By Type | Latin American | 38.0% | Japanese, Korean and Other Asian | 8.7% |
| By Product | Frozen Ethnic Food | 24.0% | Noodles | 8.4% |
| By Storage Type | Ambient Shelf Stable | 52.0% | Frozen | 7.9% |
| By Distribution Channel | Grocery (Super/Hyper) | 47.0% | Pure Online | 10.2% |
Request a Free Sample
Fill in your details and we'll send you a free sample report.
- Sample data tables & charts
- Research methodology
Population, home cooking, stores and plants lift sales
How much do Hispanic and Asian households anchor demand?
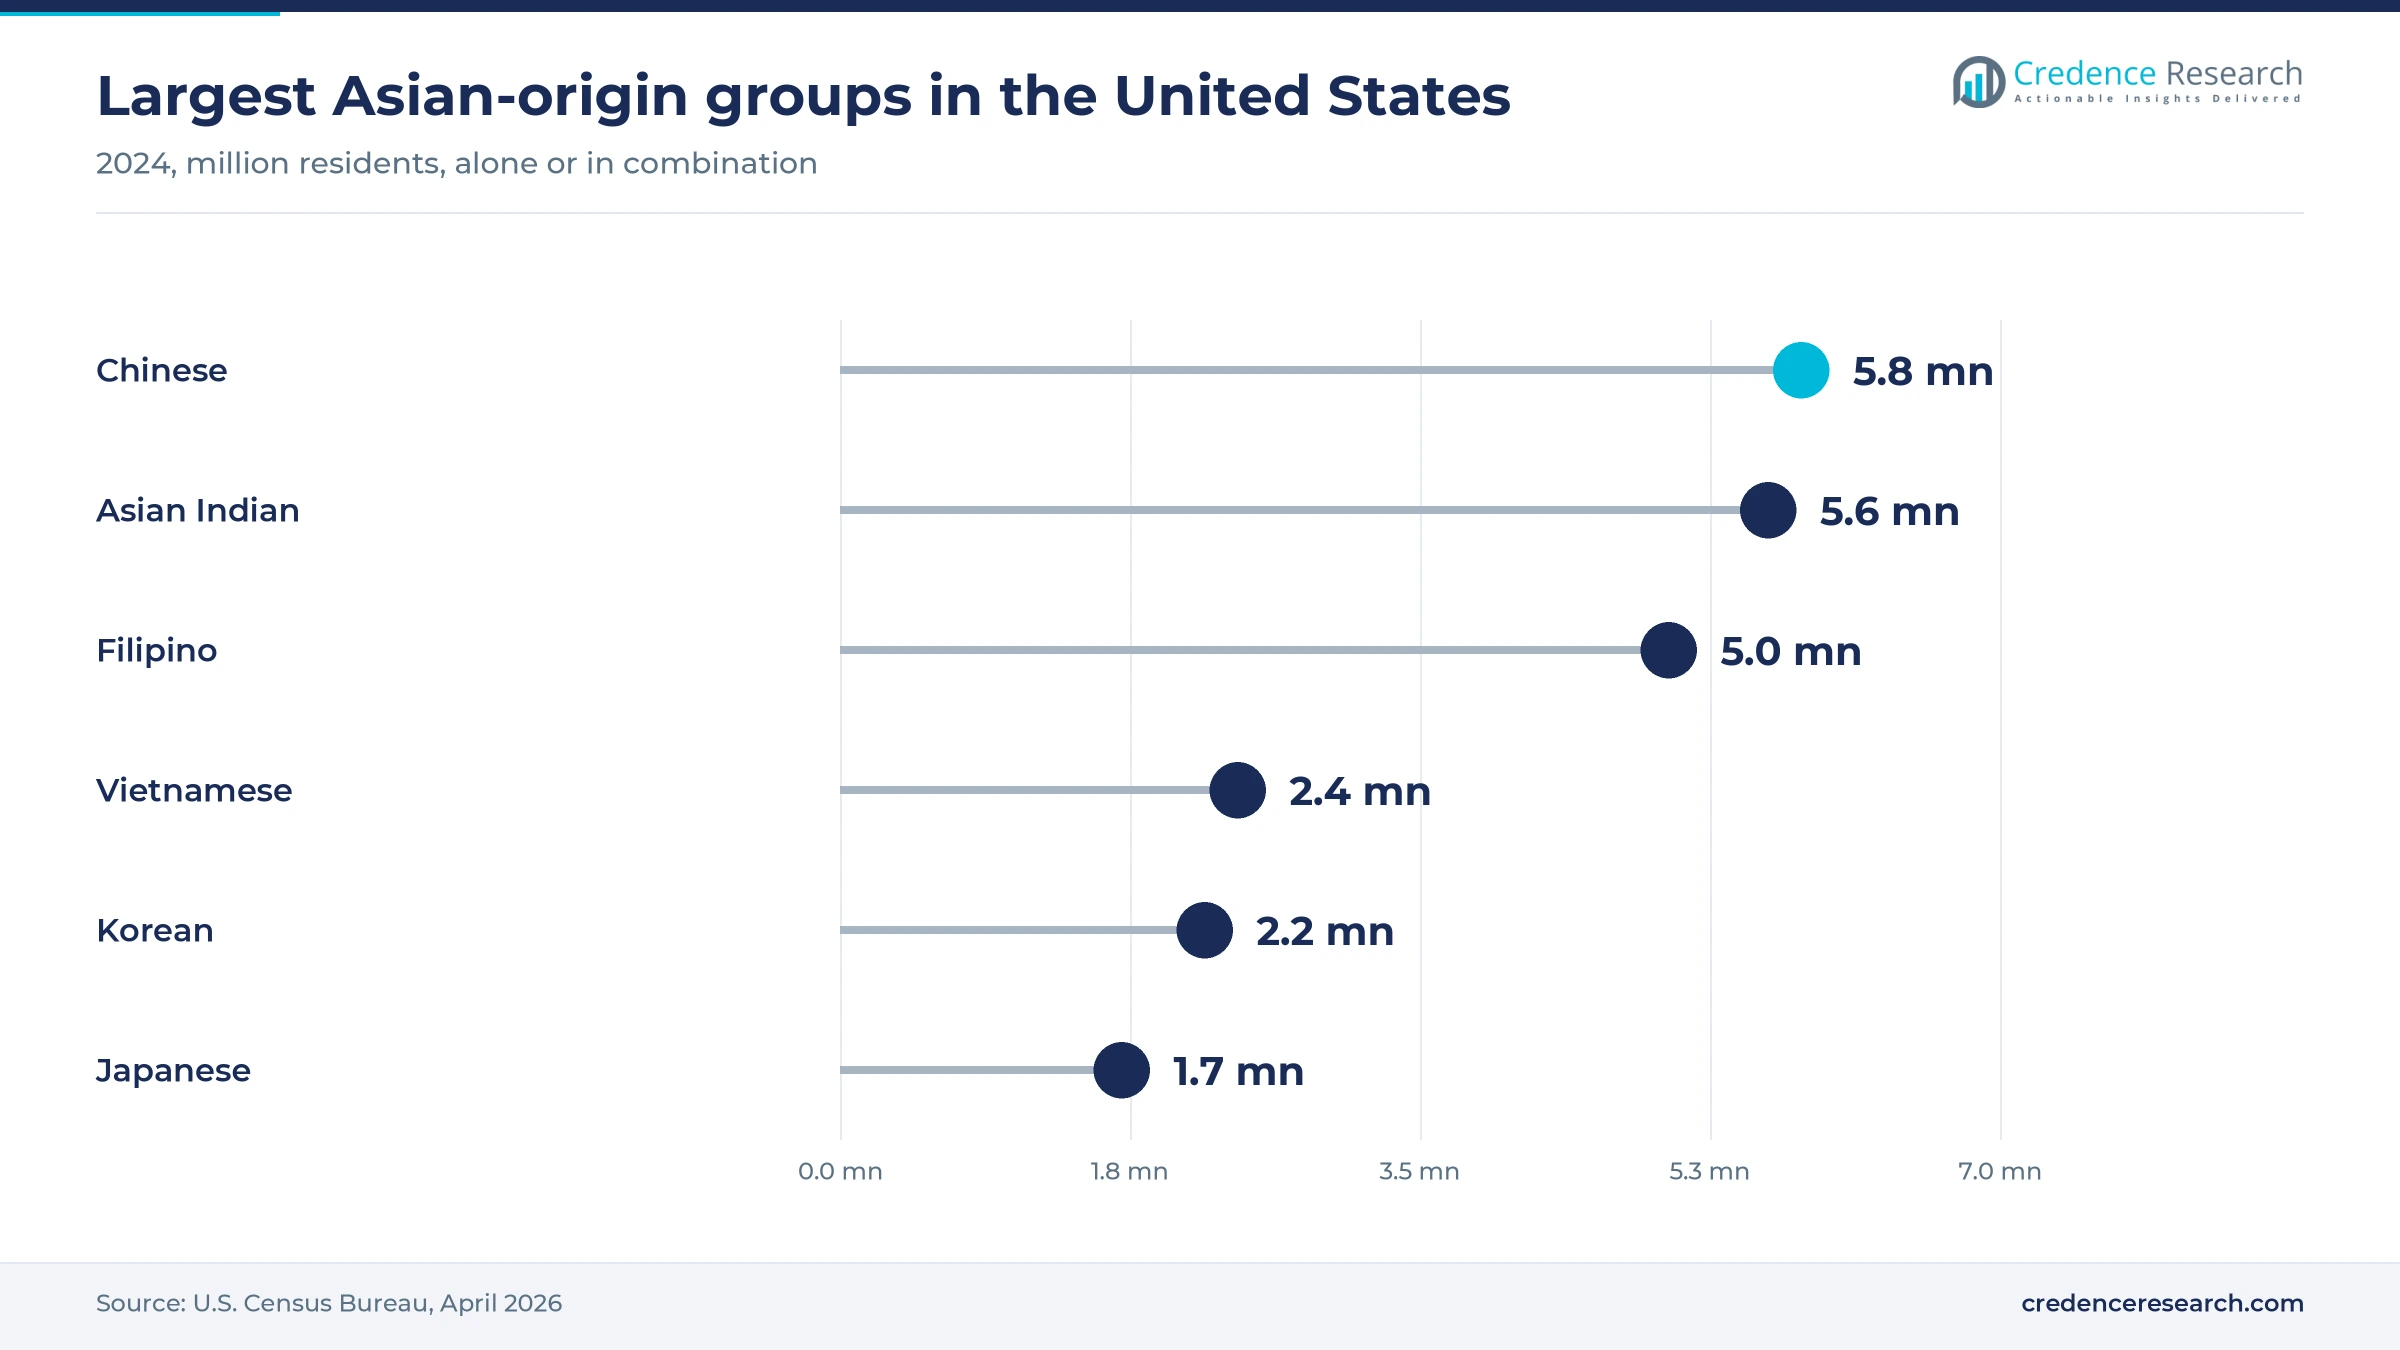
Population growth among Hispanic and Asian residents sets the base of demand because these households buy cuisine staples every week. The Census Bureau counted about 68 million Hispanic residents on July 1, 2024, or 20% of the population, and 15 states now hold at least one million. The same agency put the Asian alone-or-in-combination population at 26.8 million in 2024, led by Chinese, Asian Indian and Filipino groups. According to Stateline, Hispanic, Asian and multiracial residents made up 93% of national population growth in 2024. As a result, Latin American cuisine retains 38.0% of 2025 value, while grocers now open stores around these communities well beyond the coasts.
Why is cooking at home in America widening the buyer base?
Mainstream kitchens now supply a growing part of demand, which helps explain why cuisine sales keep rising as immigration slows. Food Technology magazine reported in July 2025 that global cuisines rank second only to poultry as the most frequent at-home dinner option. The same article cited FMI, The Food Industry Association, showing that 37% of meal preparers are very interested in bold global recipes. It also reported frozen global street food sales of USD 543.5 million, up 26% over two years. Mainstream retailers responded, and Grocery (Super/Hyper) now holds 47.0% of 2025 value. In turn, brands that once relied on specialty stores gain national shelf space and a far larger pool of first-time buyers.
What are specialty grocers adding to reach new shoppers?
Store openings put full cuisine ranges within reach of new shoppers, and the largest chains are entering new metropolitan markets. H Mart operates more than 100 stores across 18 states, according to the Korea Daily, and added Urbana, Illinois and Las Vegas in early 2025. CoStar reported in January 2026 that H Mart plans a two-story, 100,000-square-foot store in Fremont, California, its largest in the country. Grocery Dive reported that 99 Ranch Market, with more than 60 stores in 11 states, scheduled its first New York City store for July 25, 2025. JLL noted in May 2026 that these retailers seek vacancies of 20,000 to 50,000 square feet, even though vacancy in grocery-anchored centers is tight, according to the same firm.
Which ethnic food manufacturing plants signal lasting demand?
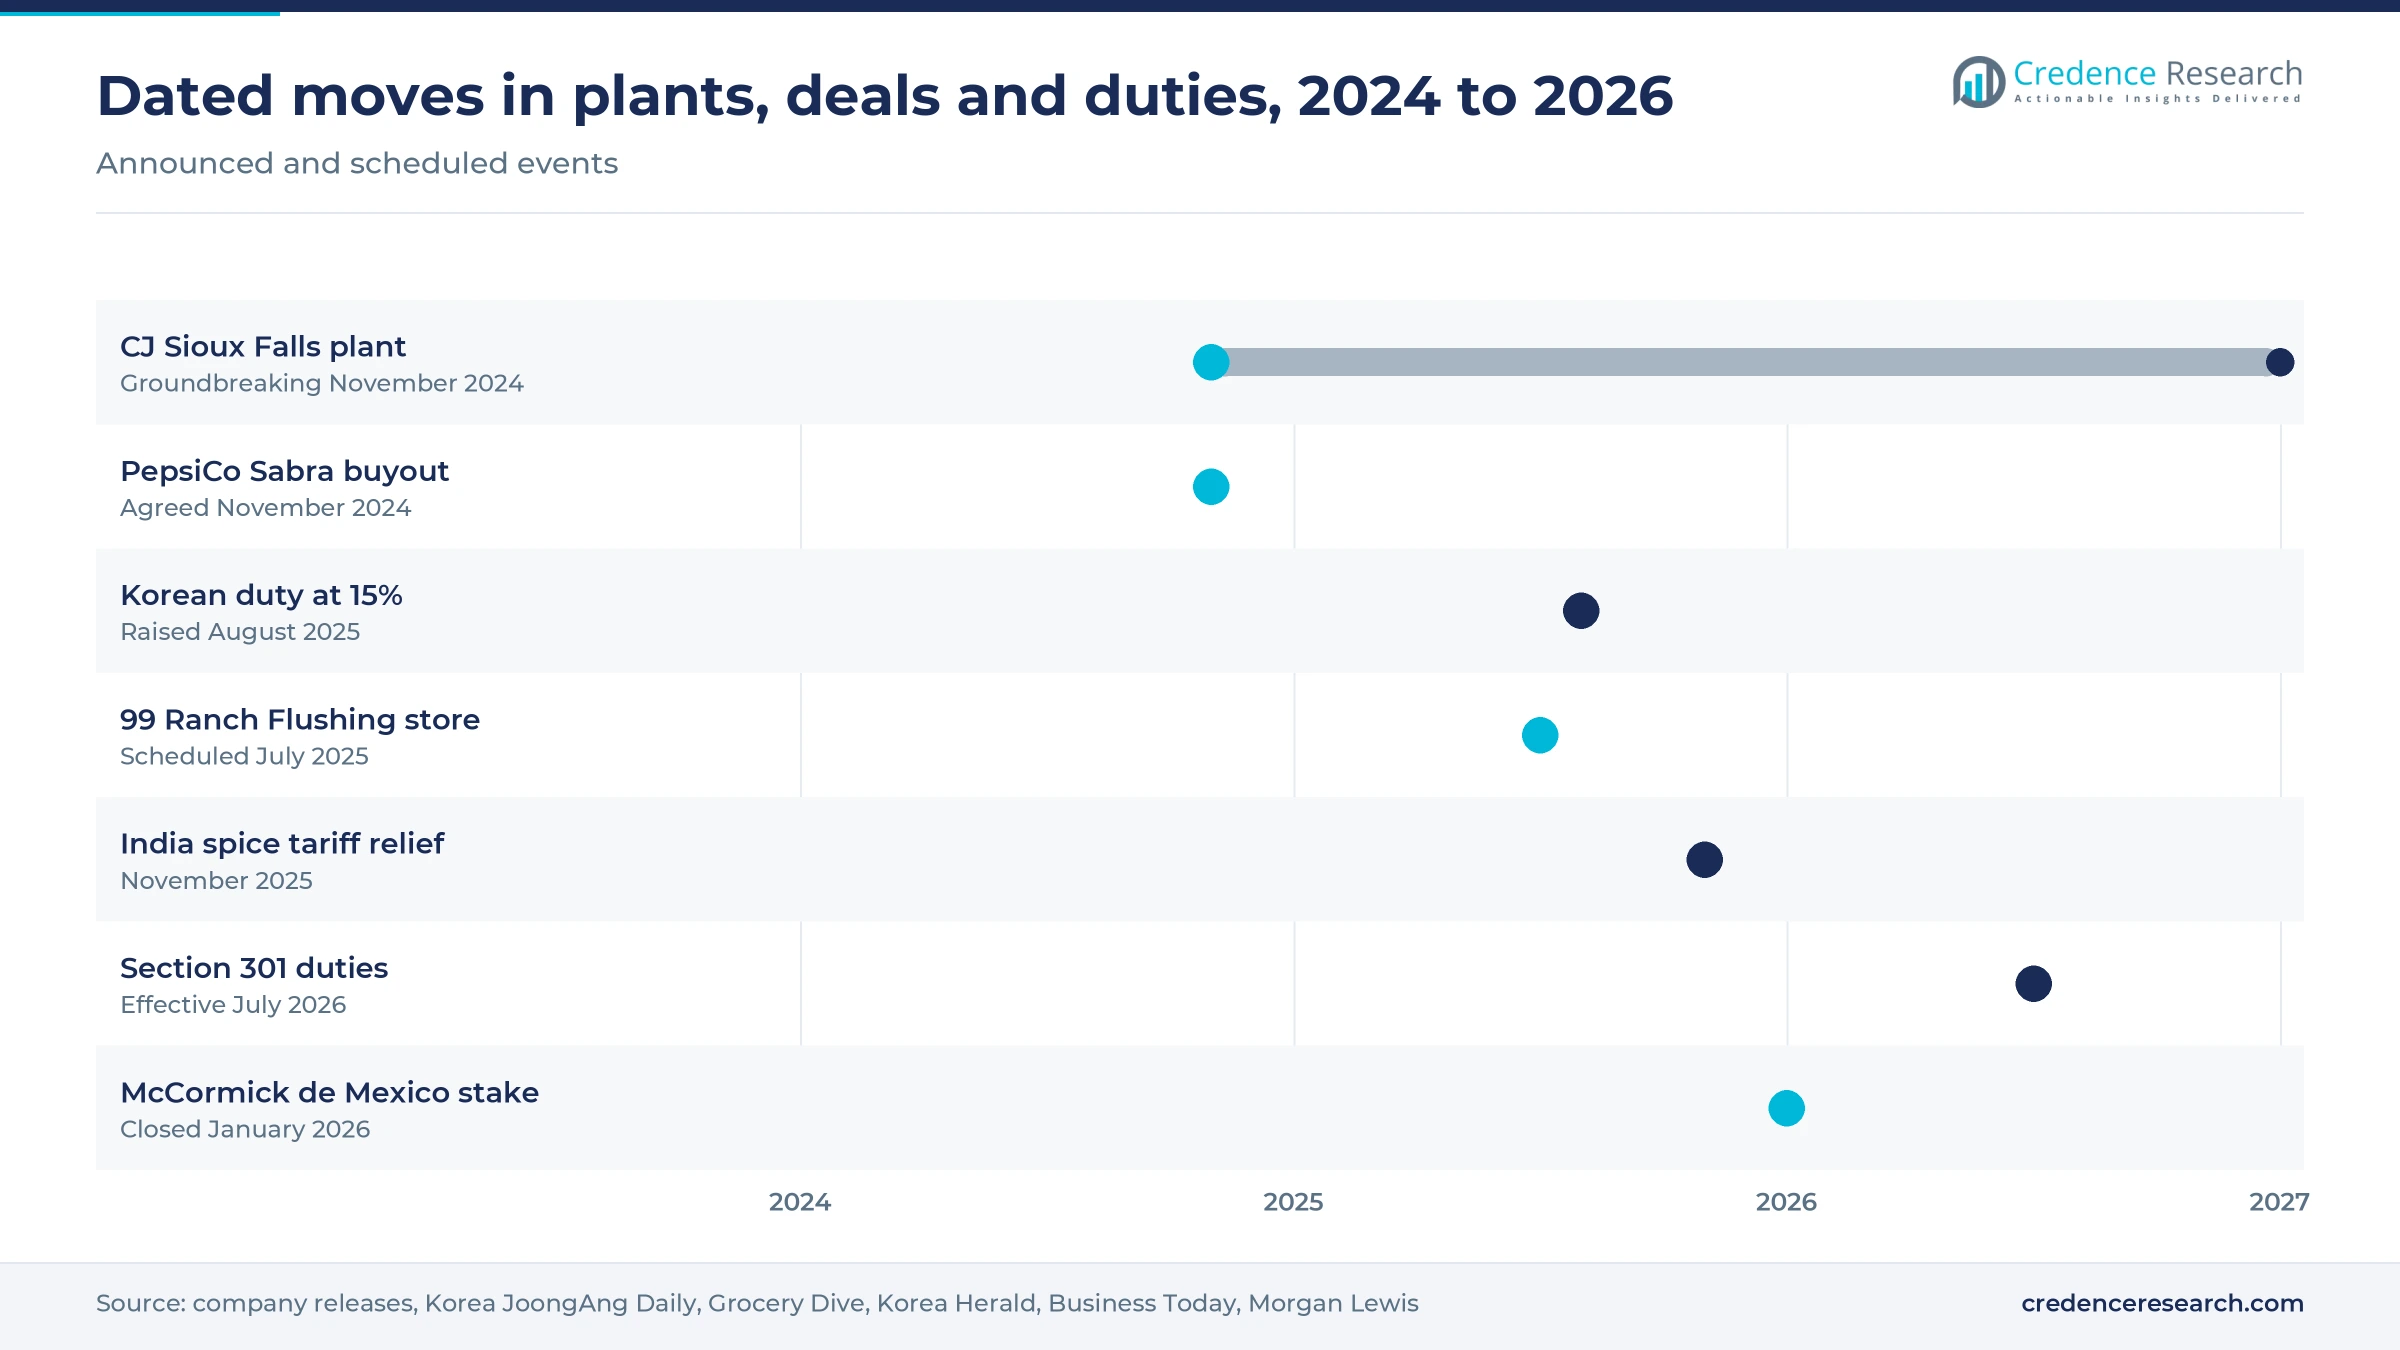
New domestic capacity is the clearest sign that manufacturers expect this demand to last. CJ CheilJedang broke ground on Nov. 13, 2024, on a Sioux Falls, South Dakota, plant through Schwan's Company, committing about 700 billion won. The Korea JoongAng Daily reported that the site should become the largest Asian food plant in North America when it is finished in 2027. FoodNavigator reported that the plant will employ more than 600 people. Food Processing lists Portland, Oregon, among Ajinomoto Foods North America's U.S. plants, and a company job listing for that plant recruits gyoza production staff. Consequently, Frozen products grow at 7.9% a year, the fastest rate among storage types through 2035.
Online grocers and takeout-style frozen reshape buying
Shift toward online grocers built around Asian and Latino baskets
Buying is shifting toward apps that stock what general grocers do not carry, especially for Asian and Latino households. The South China Morning Post reported in February 2026 that Weee! sells more than 300,000 goods and launched MasGusto, a separate Latino goods app, in 2025. The same report said that U.S. e-grocery sales rose 32% year over year to a record USD 12.7 billion in December 2025. Asian grocery delivery rival Yami, founded in 2013, competes for the same households. Pure Online therefore grows at 10.2% a year from a small base. Because these apps ship imported goods nationwide, shoppers far from a specialty store can now buy the same brands as city residents.
Rise of takeout-style frozen meals with global flavors
Frozen aisles are borrowing from restaurant menus, which brings global flavors to shoppers who might never visit a specialty store. Conagra Brands reported on Jan. 14, 2026, that the U.S. frozen food category reached USD 93.5 billion, with takeout-style items a major driver. Food Technology magazine said burrito bowl mentions on restaurant menus rose 31% over four years, showing how a Mexican format spreads between channels. The National Restaurant Association ranked global comfort foods seventh in its 2026 culinary forecast, published on Nov. 19, 2025. In turn, Frozen Ethnic Food holds 24.0% of 2025 value. Brands now develop bowls, dumplings and bites that reheat quickly and taste close to a takeout order.
Opening in Indian staples as spice tariffs ease
Indian foods offer a clear opening because the community is large and the retail network is still expanding. The Census Bureau counted 5.6 million Asian Indian residents in 2024, close to the 5.8 million Chinese population. Pew Research Center, however, found that Indian cuisine accounts for only 7% of Asian restaurants, far below Chinese. Business Today reported on Nov. 16, 2025, that black pepper, cardamom, turmeric, cumin and cloves were among nearly 200 items relieved from U.S. tariffs, covering a trade in which Indian spice exports topped USD 500 million in 2024. Adweek said in October 2026 that Patel Brothers is opening new locations quickly, so manufacturers of simmer sauces and ready meals gain more shelf space.
Opening in Mediterranean dips and African staples
Mediterranean, Middle Eastern and African foods remain smaller, leaving room for brands that can widen use beyond holidays. PepsiCo agreed in November 2024 to buy the remaining 50% of Sabra from Strauss Group, according to Food Processing. FoodNavigator reported in December 2024 that total hummus sales are near USD 1 billion, with shoppers buying only about four times a year. That low frequency is the opening for chilled hummus and dips. African staples are at an earlier stage, as Bold Afrika placed yam flour and garri in African stores around Washington in August 2025, according to ThisDay. The National Restaurant Association also named Caribbean curry bowls as a 2026 menu trend.
Tariffs, lead alerts and slower migration test margins
What did the 2025 duties do to Korean product prices?
Korean shelf prices moved first, which tested how far shoppers would follow. The Korea Herald reported on Oct. 31, 2025, that Buldak instant noodle five-packs rose from USD 6.88 to USD 7.84 at Walmart online after the U.S. duty went from 10% to 15%. Rice-processed exports to the United States fell 4.8% in the first eight months of 2025, according to Asia Economy. U.S. plants offer one answer, although those lines take years to build.
Why do changing duty rules complicate import planning?
Importers have had to reprice repeatedly, which complicates sourcing for rice brands and Indian grocers alike. Dawn reported on Aug. 12, 2025, that Indian basmati faced a 50% duty against 19% on Pakistani rice. The Supreme Court then struck down those emergency tariffs on Feb. 20, 2026, according to Thompson Coburn. Morgan Lewis reported that Section 301 duties took effect on July 24, 2026, at 10% for India, with annexes exempting listed agricultural commodities. Contract pricing therefore remains difficult for small importers and their retail customers.
How far did the cinnamon lead alert spread?
Ground cinnamon shows how one safety failure can spread across many small brands and erode trust in imported spices. The FDA public health alert, first issued on March 6, 2024, covered 16 brands by Oct. 10, 2025, according to Powder & Bulk Solids. The agency advised consumers to discard the products and asked makers to recall them voluntarily. Credence Research expects smaller importers to carry most of the risk, while larger brands can use documented testing as a selling point.
How much will slower immigration weigh on growth?
Slower immigration threatens the newest households, which are often the most loyal buyers of imported staples. The South China Morning Post cited Census Bureau data showing that net international migration fell from 2.7 million in 2024 to 1.3 million by July 1, 2025, with about 321,000 projected for 2026. Brands that depend on recent arrivals could therefore see slower volume gains. The practical response is to court second-generation and mainstream shoppers, whose purchases do not depend on new arrivals.
West and South hold two-thirds of cuisine spending
| Region | Value, 2025 (USD billion) | Share, 2025 | CAGR, 2026–2035 |
|---|---|---|---|
| West | 9.32 | 34.0% | 7.0% |
| South | 9.04 | 33.0% | 7.7% |
| Northeast | 5.48 | 20.0% | 6.8% |
| Midwest | 3.56 | 13.0% | 7.2% |
West leads on California's restaurant and grocery density
The West held 34.0% of 2025 value and grows at 7.0% a year, led by California. Pew Research Center found that 85% of counties have a Mexican restaurant and California holds 22% of those restaurants. A separate Pew Research Center analysis from May 2023 found that Asian food exceeds 15% of restaurants in Hawaii, California, Washington, Nevada and New York. Grocery Dive noted that T&T Supermarket opened its first U.S. store in Bellevue, Washington, in December 2024. As a result, the region remains the first stop for new brands entering the country.
South gains the most from Texas and Florida population growth
The South held 33.0% of 2025 value and is the fastest-growing region at 7.7% a year in regional demand. Stateline reported that Texas added about 563,000 residents in 2024, with Hispanic, Asian and multiracial groups accounting for 86%, while Florida added about 467,000. Pew also found that Texas holds 17% of Mexican restaurants nationally. H Mart was preparing its first Florida store in 2025, according to Grocery Dive, which shows how quickly specialty formats are following these households.
Northeast relies on dense New York and New Jersey communities
The Northeast held 20.0% of 2025 value and grows at 6.8% a year, the slowest pace, because its store networks are already mature. Pew counted New York and New Jersey among the five states holding 45% of Asian restaurants. New investment continues regardless, since 99 Ranch Market chose Flushing, Queens, for a 37,000-square-foot store with 23 food hall vendors. NYU's Furman Center reported that more than half of Flushing residents identified as Asian in 2023.
Midwest grows through Illinois stores and South Dakota production
The Midwest held 13.0% of 2025 value and grows at 7.2% a year, with Illinois as its main consumer base. Pew found that Illinois holds 4% of Mexican restaurants, and the Korea Daily reported that H Mart opened a 35,000-square-foot Urbana store in January 2025, its first in the state outside the Chicago area. The region also matters for supply, since the Sioux Falls plant is due to produce steamed dumplings and egg rolls from 2027.
Plants, buyouts and flagship stores mark 2024 to 2026
| Development | Status and market relevance |
|---|---|
| In November 2024, CJ CheilJedang broke ground on its Sioux Falls, South Dakota, plant through Schwan's Company. | Under construction, completion expected in 2027 |
| In November 2024, PepsiCo agreed to buy the remaining 50% of Sabra Dipping Co. from Strauss Group. | Gives one owner full control of a leading chilled dip brand |
| In April 2025, MegaMex Foods added Herdez al pastor shredded pork to its refrigerated Mexican entrees. | Sold through major retailers at USD 9.98 to USD 10.98 |
| In July 2025, 99 Ranch Market scheduled its first New York City store for Flushing, Queens. | Adds a 37,000-square-foot store and an underground food hall |
| In January 2026, McCormick & Company closed its purchase of an added 25% of McCormick de Mexico. | Gives McCormick control of its joint venture business with Grupo Herdez |
Traceability rules and apps change how goods move
- Traceability records apply to listed foods and ingredients, and the FDA says Congress directed it not to enforce the rule before July 20, 2028, which gives importers more time to prepare.
- Shopping apps let shoppers order imported goods without a nearby store, as Weee! did for 1.5 million buyers in 2025.
- Food halls turn grocery trips into a tasting occasion, as the 23 vendors in the 99 Ranch Market Flushing store show.
- Domestic frozen lines shorten supply routes for dumplings and egg rolls, reducing exposure to import duties once the Sioux Falls plant opens.
Need a Custom Version of This Report?
Tailor the scope, geography, or segments to your exact requirements.
- Custom geography or segment scope
- Direct access to our analyst team
Heritage brands, Korean groups and grocers compete
Competition splits into four groups that increasingly meet on the same shelf. Heritage brands lead Latin staples, and Goya Foods, described by Hispanic Ad in January 2026 as the largest Hispanic-owned food company in the country, sells more than 2,500 products. Asian multinationals have the most visible investment plans, with CJ CheilJedang building in South Dakota and Ajinomoto Foods North America producing gyoza in Oregon. U.S. food groups compete through brands and formats, as PepsiCo does with Sabra and MegaMex Foods does with Herdez refrigerated meals. Specialist distribution is a quieter source of advantage, since HF Foods Group reports about 15,000 customer locations and 16 distribution centers, mainly serving Asian restaurants. Retailers such as H Mart and 99 Ranch Market also shape brand access through their own buying decisions. Scale matters more each year because tariffs and safety testing fall hardest on small importers.
Companies profiled and their roles in this market
| Company | Type | Role in the market |
|---|---|---|
| Goya Foods | Heritage brand | Latin staples such as beans, rice, adobo and sazón sold in major supermarkets |
| CJ CheilJedang (Schwan's Company) | Manufacturer | Bibigo dumplings, with a 42% consumer dumpling share reported by the Korea JoongAng Daily |
| Ajinomoto Foods North America | Manufacturer | Frozen Asian foods, including gyoza production in Portland, Oregon |
| McCormick & Company, Inc. | Ingredient brand | Taco seasoning mixes, Cholula hot sauce and Thai Kitchen Asian sauces and noodles |
| Conagra Brands, Inc. | Food group | P.F. Chang's Home Menu frozen meals and Frontera Mexican sauces and salsas |
| PepsiCo (Sabra) | Food group | Sole owner of the Sabra chilled dip business after the November 2024 agreement |
| MegaMex Foods | Food group | Herdez refrigerated entrees and Mexican sauces through national retailers |
| Samyang Foods | Importer brand | Buldak instant noodles sold through Walmart and other national retailers |
| HF Foods Group | Distributor | Foodservice supply to Asian restaurants across 46 states |
| H Mart | Specialty grocer | Korean-American chain with more than 100 stores in 18 states |
| 99 Ranch Market | Specialty grocer | Asian grocery chain with more than 60 stores in 11 states |
| Weee! | Online grocer | Asian and Latino grocery delivery, plus the MasGusto app launched in 2025 |
Domestic production decides who keeps the margin
Credence Research's view is that the most important contest in this market is now about where products are made. Duties raised Korean shelf prices during 2025 and changed again in 2026, and the Sioux Falls project shows that a major Asian group is building in the country rather than relying on imports. Brands with U.S. production are better insulated from duty swings than importers, which should steadily shift share toward them. Population still sets the floor, but slower migration means mainstream repeat purchases must supply more of the increase. Companies that win second-generation households and mainstream home cooks should therefore grow faster than those relying on recent arrivals.
How the 2025 value and splits were estimated
The report uses 2025 as the base year and 2026 to 2035 as the forecast period. The earlier Credence Research estimate for 2024 was carried forward one year at its own stated growth rate and then tested against a population-based consumption check. Market values come from the Credence Research model, and segment and regional splits are Credence Research estimates. Sources are government statistics, company filings and releases, trade publications and news reports, and no interviews or surveys were conducted for this update.
Mainstream baskets carry growth through 2035
The market should reach USD 55.07 billion by 2035, with the South and Japanese, Korean and Other Asian foods gaining the most ground. Growth in the first years will depend on how duty rules settle and how much output the Sioux Falls plant adds after 2027. Demand later in the period should rest more on mainstream repeat buying, because net migration is projected to slow to about 321,000 in 2026. Retail will stay the largest route to households, although online grocers should keep taking share from a small base, and importers will need stronger testing records by 2028.
Frequently Asked Questions
How big is the U.S. ethnic food market?
What is driving ethnic food market growth in the United States?
What are the main ethnic food market trends?
What are the main ethnic food categories in the United States?
How available are Mexican, Chinese and Indian cuisines in the United States?
Which ethnic food brands are best known?
Who distributes ethnic food in the USA?
Where are ethnic food manufacturing plants being built?
Table of Content
Chapter 1 Market Segmentation
- 1.1 Segmentation Framework
- 1.1.1 Product and Service Classification
- 1.1.2 Application and End-Use Classification
- 1.1.3 Technology and Solution Classification
- 1.1.4 Customer and Distribution Channel Classification
- 1.1.5 Geographic Segmentation
- 1.1.6 Market Segment Definitions and Boundaries
- 1.2 By Type
- 1.2.1 Latin American
- 1.2.2 Chinese
- 1.2.3 Japanese, Korean and Other Asian
- 1.2.4 Southeast Asian
- 1.2.5 Indian
- 1.2.6 Mediterranean and Middle Eastern
- 1.2.7 African and Afro-Caribbean
- 1.2.8 Others
- 1.3 By Product
- 1.3.1 Frozen Ethnic Food
- 1.3.2 Sauces and Condiments
- 1.3.3 Rice
- 1.3.4 Noodles
- 1.3.5 Spices and Herbs
- 1.3.6 Snacks
- 1.3.7 Pulses and Soups
- 1.3.8 Beverages
- 1.3.9 Other Products
- 1.4 By Storage Type
- 1.4.1 Ambient Shelf Stable
- 1.4.2 Frozen
- 1.4.3 Fresh and Chilled
Chapter 2 Introduction
- 2.1 Report Objectives and Scope
- 2.2 Product Definition and Industry Terminology
- 2.3 Market Inclusions and Exclusions
- 2.4 Research Process
- 2.4.1 Primary Research and Expert Interviews
- 2.4.2 Secondary Research and Source Review
- 2.4.3 Top-Down and Bottom-Up Estimation
- 2.4.4 Data Triangulation and Verification
- 2.5 Market Size Measurement Basis
- 2.5.1 2025: USD 27.40 billion → 2035: USD 55.07 billion
- 2.6 Historical and Forecast Reference Periods
- 2.6.1 Historical Period: 2018-2025
- 2.6.2 Base Year: 2025
- 2.6.3 Forecast Period: 2025-2035
- 2.7 Research Assumptions and Limitations
Chapter 3 Executive Summary
- 3.1 Market Snapshot and Key Findings
- 3.2 Base-Year Market Size, 2025
- 3.3 Forecast Market Size, 2035
- 3.4 Revenue and Volume Growth Outlook
- 3.5 Key Demand and Supply Indicators
- 3.6 Leading Market Segments
- 3.7 Fastest-Growing Market Opportunities
- 3.8 Regional Performance Highlights
- 3.9 Technology and Industry Transformation
- 3.10 Competitive Landscape Summary
- 3.11 Analyst View and Strategic Implications
Chapter 4 U.S. Ethnic Food Market Trends and Developments
- 4.1 Historical Industry Development, 2018-2025
- 4.2 Recent Market Trends and Developments
- 4.3 Demand and Customer Behavior Trends
- 4.4 Technology and Product Innovation
- 4.5 Artificial Intelligence, Automation and Digitalization
- 4.6 Local Manufacturing and Supply Chain Realignment
- 4.7 Industry Partnerships, Mergers and Acquisitions
- 4.8 Sustainability and Circular Economy Developments
- 4.9 Government and Private Sector Investment Trends
- 4.10 Emerging Business Models and Commercialization
- 4.11 Industry Developments and Announcements
Chapter 5 U.S. Ethnic Food Market Production, Supply and Demand Analysis
- 5.1 Demand Trend and Consumption Analysis, 2018-2025
- 5.2 Demand Forecast, 2025-2035
- 5.3 Production and Output Trend, 2018-2025
- 5.4 Production and Output Forecast, 2025-2035
- 5.5 Installed Capacity and Capacity Utilization
- 5.6 Company-Wise Production Plants and Statistics
- 5.6.1 Installed Production Capacity
- 5.6.2 Actual Production
- 5.6.3 Planned Capacity and Expansion Targets
- 5.7 Supply Chain Structure and Procurement Trends
- 5.8 Supply-Demand Gap and Bottlenecks
- 5.9 Import Dependence and Sourcing Structure
- 5.10 Contract Manufacturing and Outsourcing
- 5.11 Regional Supply and Demand Concentration
Chapter 6 U.S. Ethnic Food Market Pricing Analysis
- 6.1 Pricing Structure and Measurement
- 6.2 Historical Pricing Trends, 2018-2025
- 6.3 Pricing Outlook, 2025-2035
- 6.4 Average Selling Price and Unit Economics
- 6.5 Pricing by Product and Market Segment
- 6.6 Geographic Pricing Differences
- 6.7 Key Input, Energy, Labor and Logistics Costs
- 6.8 Contract Pricing and Purchasing Models
- 6.9 Pricing Sensitivity and Competitive Positioning
- 6.10 Price, Margin and Profitability Implications
Chapter 7 U.S. Ethnic Food Market Dynamics
- 7.1 Market Growth Drivers
- 7.1.1 Demand-Side Drivers
- 7.1.2 Technology and Innovation Drivers
- 7.1.3 Infrastructure and Investment Drivers
- 7.1.4 Regulatory and Policy Drivers
- 7.2 Market Restraints
- 7.2.1 Cost and Affordability Constraints
- 7.2.2 Technology and Adoption Barriers
- 7.2.3 Supply Chain and Operational Constraints
- 7.3 Market Challenges
- 7.3.1 Competitive Pressure and Margin Erosion
- 7.3.2 Skills, Infrastructure and Implementation Gaps
- 7.4 Emerging Market Opportunities
- 7.5 Market Dynamics Impact and Time-Horizon Assessment
Chapter 8 U.S. Ethnic Food Value Chain Analysis
- 8.1 Industry Value Chain Overview
- 8.2 Upstream Suppliers and Critical Inputs
- 8.3 Technology and Component Providers
- 8.4 Manufacturing or Service Delivery
- 8.5 Distribution, Channel Partners and Integrators
- 8.6 Downstream Applications and End Users
- 8.7 Value Addition and Profit Pools
- 8.8 Vertical Integration and Outsourcing
- 8.9 Supplier Concentration and Risk
- 8.10 Supply Chain Localization and Resilience
Chapter 9 U.S. Ethnic Food Market Regulations and Policies
- 9.1 Relevant Laws, Standards and Compliance Frameworks
- 9.2 Product, Service, Safety and Quality Requirements
- 9.3 Government Policies, Incentives and Subsidies
- 9.4 Imports, Exports and Trade Barriers
- 9.5 Public Procurement and Local Content Requirements
- 9.6 Environmental and Sustainability Compliance
- 9.7 Upcoming Policy Changes and Market Implications
Chapter 10 U.S. Ethnic Food Market Hotspots and Opportunities
- 10.1 Market Opportunity Mapping and Growth Hotspots
- 10.2 High-Growth Applications and Customer Groups
- 10.3 Underserved Markets and White-Space Opportunities
- 10.4 Emerging Technology and Product Opportunities
- 10.5 New Capacity and Investment Hotspots
- 10.6 Market Entry and Expansion Opportunities
- 10.7 Distribution and Partnership Opportunities
- 10.8 Near-Term and Long-Term Commercial Potential
- 10.9 Opportunity Attractiveness and Execution Risks
Chapter 11 U.S. Ethnic Food Market Outlook, 2025-2035
- 11.1 Market Size and Analysis
- 11.1.1 Revenue (Market Measurement: 2025: USD 27.40 billion → 2035: USD 55.07 billion)
- 11.1.2 Market Volume and Quantity Sold
- 11.1.3 Historical Market Size, 2018-2025
- 11.1.4 Base-Year Market Size, 2025
- 11.2 Market Forecast, 2025-2035
- 11.2.1 Revenue Forecast to 2035
- 11.2.2 Volume Forecast to 2035
- 11.2.3 CAGR and Year-on-Year Growth
- 11.2.4 Incremental Revenue Opportunity
- 11.3 Forecast Assumptions and Scenario Analysis
- 11.3.1 Base-Case Forecast
- 11.3.2 Optimistic and Conservative Scenarios
- 11.3.3 Technology, Pricing and Policy Sensitivities
- 11.4 Market Attractiveness and Growth Outlook
Chapter 12 U.S. Ethnic Food Market Segmentation and Outlook
- 12.1 Segmentation Summary and Market Shares, 2025
- 12.2 Largest and Fastest-Growing Segments
- 12.3 By Type - Market Size and Forecast, 2025-2035
- 12.3.1 Segment Definition and Scope
- 12.3.2 Historical Market Size, 2018-2025
- 12.3.3 Revenue Forecast, 2025-2035
- 12.3.4 Volume Forecast, 2025-2035
- 12.3.5 Base-Year Market Share, 2025
- 12.3.6 Segment CAGR and Growth Drivers
- 12.3.7 Subsegment Market Size and Forecast
- 12.3.7.1 Latin American
- 12.3.7.2 Chinese
- 12.3.7.3 Japanese, Korean and Other Asian
- 12.3.7.4 Southeast Asian
- 12.3.7.5 Indian
- 12.3.7.6 Mediterranean and Middle Eastern
- 12.3.7.7 African and Afro-Caribbean
- 12.3.7.8 Others
- 12.3.8 Subsegment Pricing and Adoption Trends
- 12.3.9 Leading Suppliers and Competition
- 12.3.10 Regional Demand and Opportunities
- 12.4 By Product - Market Size and Forecast, 2025-2035
- 12.4.1 Segment Definition and Scope
- 12.4.2 Historical Market Size, 2018-2025
- 12.4.3 Revenue Forecast, 2025-2035
- 12.4.4 Volume Forecast, 2025-2035
- 12.4.5 Base-Year Market Share, 2025
- 12.4.6 Segment CAGR and Growth Drivers
- 12.4.7 Subsegment Market Size and Forecast
- 12.4.7.1 Frozen Ethnic Food
- 12.4.7.2 Sauces and Condiments
- 12.4.7.3 Rice
- 12.4.7.4 Noodles
- 12.4.7.5 Spices and Herbs
- 12.4.7.6 Snacks
- 12.4.7.7 Pulses and Soups
- 12.4.7.8 Beverages
- 12.4.7.9 Other Products
- 12.4.8 Subsegment Pricing and Adoption Trends
- 12.4.9 Leading Suppliers and Competition
- 12.4.10 Regional Demand and Opportunities
- 12.5 By Storage Type - Market Size and Forecast, 2025-2035
- 12.5.1 Segment Definition and Scope
- 12.5.2 Historical Market Size, 2018-2025
- 12.5.3 Revenue Forecast, 2025-2035
- 12.5.4 Volume Forecast, 2025-2035
- 12.5.5 Base-Year Market Share, 2025
- 12.5.6 Segment CAGR and Growth Drivers
- 12.5.7 Subsegment Market Size and Forecast
- 12.5.7.1 Ambient Shelf Stable
- 12.5.7.2 Frozen
- 12.5.7.3 Fresh and Chilled
- 12.5.8 Subsegment Pricing and Adoption Trends
- 12.5.9 Leading Suppliers and Competition
- 12.5.10 Regional Demand and Opportunities
- 12.6 Segment Growth Comparison
- 12.7 Segment Attractiveness and Priority Matrix
Chapter 13 U.S. Ethnic Food Geographic Market Outlook, 2025-2035
- 13.1 Domestic Market Distribution and Demand Clusters
- 13.2 State- or Province-Wise Market Size and Forecast, 2025-2035
- 13.3 City and Metropolitan Market Outlook
- 13.4 Industrial, Manufacturing and Commercial Clusters
- 13.5 Geographic Concentration of Key End Users
- 13.6 Local Pricing and Purchasing Differences
- 13.7 Domestic Production Facilities and Capacity Map
- 13.8 Local Infrastructure and Project Pipeline
- 13.9 State-Level Policy and Incentive Differences
- 13.10 Subnational Investment Hotspots and Opportunities
- 13.11 Distribution and Logistics Networks
- 13.12 Domestic Competitive Footprint
Chapter 14 U.S. Ethnic Food Technology, Innovation and Sustainability Outlook
- 14.1 Technology Landscape and Maturity
- 14.2 Product, Process and Service Innovation
- 14.3 AI, Automation and Digital Tools in the Industry
- 14.4 Technology Adoption and Performance Benchmarking
- 14.5 Innovation Pipeline and R&D Investment
- 14.6 Patent and Intellectual Property Trends
- 14.7 Energy Efficiency and Resource Management
- 14.8 Sustainability, Recycling and Circularity
- 14.9 Technology Roadmap, 2025-2035
- 14.10 Risks of Obsolescence and Technology Substitution
Chapter 15 U.S. Ethnic Food Market Key Strategic Imperatives
- 15.1 Growth and Market Entry Priorities
- 15.2 High-Return Products and Segments
- 15.3 Pricing, Profitability and Cost Optimization
- 15.4 Technology Investment and Product Differentiation
- 15.5 Supply Chain Localization and Resilience
- 15.6 Distribution and Customer Acquisition
- 15.7 Partnership, Acquisition and Capacity Strategy
- 15.8 Regional Expansion Priorities
- 15.9 Short-, Medium- and Long-Term Actions
Chapter 16 Competition Outlook
- 16.1 Industry Competition Characteristics
- 16.2 Market Structure and Concentration
- 16.3 Market Share and Competitive Positioning, 2025
- 16.4 Company-Wise Revenue and Product Benchmarking
- 16.5 Production and Service Capacity Benchmarking
- 16.6 Technology, Pricing and Differentiation
- 16.7 Regional Footprint and Distribution Strength
- 16.8 Mergers, Acquisitions and Strategic Alliances
- 16.9 New Entrants and Competitive Threats
- 16.10 Porter's Five Forces and Industry Attractiveness
- 16.11 Competitive Outlook, 2025-2035
Chapter 17 Company Profiles
- 17.1 Company Coverage and Selection Criteria
- 17.2 Goya Foods
- 17.2.1 Business Description
- 17.2.2 Company Ownership and Geographic Presence
- 17.2.3 Product and Service Portfolio
- 17.2.4 Manufacturing and Operating Footprint
- 17.2.5 Production Capacity and Expansion Plans
- 17.2.6 Financial Performance and Investment
- 17.2.7 Market Share and Competitive Position
- 17.2.8 Technology and Innovation Capabilities
- 17.2.9 Strategic Alliances or Partnerships
- 17.2.10 Recent Developments
- 17.2.11 Growth Strategy and Outlook
- 17.3 CJ CheilJedang (Schwan's Company)
- 17.4 Ajinomoto Foods North America
- 17.5 McCormick & Company, Inc.
- 17.6 Conagra Brands, Inc.
- 17.7 PepsiCo (Sabra)
- 17.8 MegaMex Foods
- 17.9 Samyang Foods
- 17.10 HF Foods Group
- 17.11 H Mart
- 17.12 99 Ranch Market
- 17.13 Weee!
- 17.14 Other Relevant Market Participants
Note: Every listed company is profiled on the structure shown under the first company. The company list is preliminary and may change based on research findings, market developments, data availability and client requirements.
Chapter 18 Disclaimer
- 18.1 Research and Forecast Disclaimer
- 18.2 Data Source and Estimation Limitations
Note: The depth of individual sections depends on data availability for this market. Volume, capacity, trade and other unit-based metrics are included where applicable.

