
Market Overview
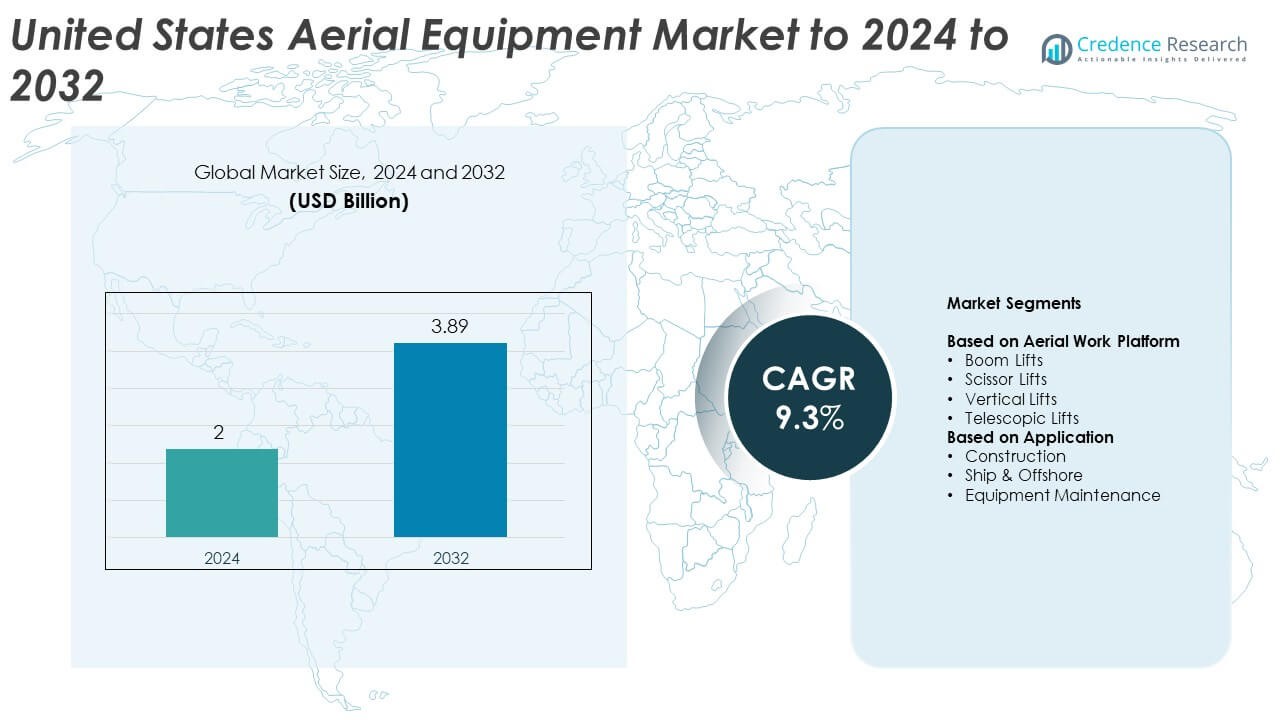
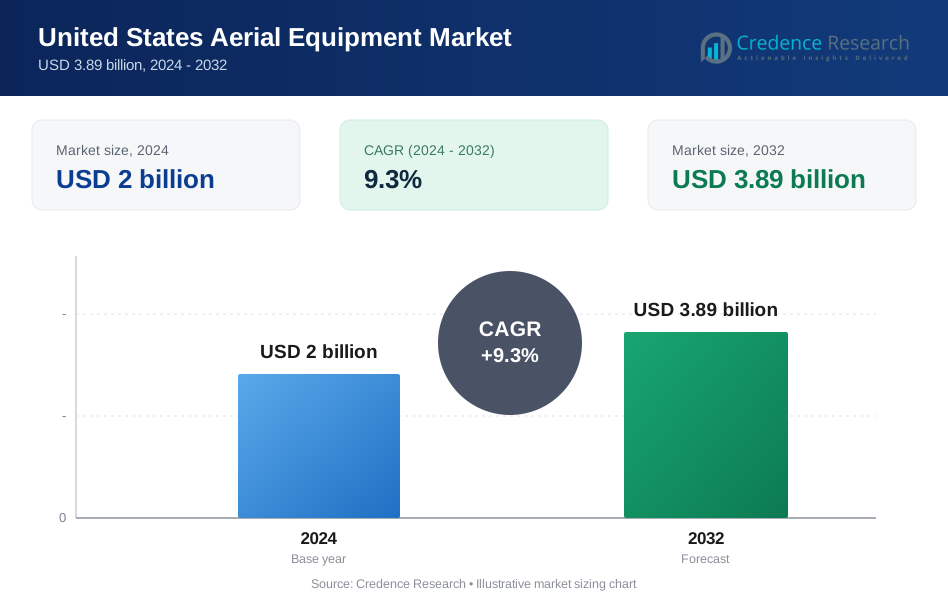
United States Aerial Equipment Market size was valued at USD 2 billion in 2024 and is anticipated to reach USD 3.89 billion by 2032, at a CAGR of 9.3% during the forecast period.
| REPORT ATTRIBUTE | DETAILS |
|---|---|
| Historical Period | 2020-2023 |
| Base Year | 2024 |
| Forecast Period | 2025-2032 |
| United States Aerial Equipment Market Size 2024 | USD 2 Billion |
| United States Aerial Equipment Market, CAGR | 9.3% |
| United States Aerial Equipment Market Size 2032 | USD 3.89 Billion |
The United States Aerial Equipment Market is driven by leading companies such as Haulotte Group, Teupen USA, Terex Corporation, Manitex International, Skyjack, Snorkel International, Morbark LLC, ReachMaster, Aichi Corporation, and JLG Industries, all competing across boom lifts, scissor lifts, and specialised platforms. These players focus on safety upgrades, electric models, and high-reach innovations to meet growing construction and industrial needs. Among the key U.S. cities analysed, New York leads the market with a 24% share due to dense construction activity and continuous infrastructure upgrades. Los Angeles, Chicago, Houston, and Atlanta follow with strong but smaller shares supported by local industrial and commercial expansion.
Market Insights
- The United States Aerial Equipment Market is valued at USD 2 billion in 2024 and is projected to reach USD 3.89 billion by 2032 at a CAGR of 9.3%.
- Demand grows due to strong construction activity, infrastructure upgrades, and rising adoption of boom lifts, which hold a 46% segment share supported by high-reach requirements across commercial and industrial sites.
- Key trends include rapid shift toward electric and hybrid aerial platforms, wider telematics integration, and increased use of compact lifts in warehouse and logistics hubs across major U.S. cities.
- Competition intensifies as major manufacturers focus on advanced safety systems, fleet modernisation, and rental partnerships, while smaller players strengthen service networks to improve equipment availability and reduce downtime.
- New York leads regional demand with a 24% share, followed by Los Angeles at 18%, Chicago at 14%, Houston at 12%, and Atlanta at 9%, reflecting strong construction density and varied industrial applications across these major U.S. cities.
Market Segmentation Analysis:
By Aerial Work Platform
Boom lifts lead this segment with a 46% share, supported by their extended reach and strong demand across complex construction and industrial maintenance tasks. These lifts offer flexible height access for multi-story work, which strengthens adoption in commercial building projects. Scissor lifts remain popular for safe vertical elevation in indoor and outdoor sites, while vertical lifts grow in warehouses due to compact size and easy mobility. Telescopic lifts advance as infrastructure upgrades increase the need for long-reach equipment across utilities and bridge maintenance.
- For instance, Genie introduced the SX-180 boom lift with a 54.9-meter working height and a 3.05-meter rotating jib, enabling operators to work at extreme elevations with precise positioning.
By Application
Construction dominates the application segment with a 58% share, driven by ongoing commercial expansion, highway upgrades, and strong residential refurbishment activity across the United States. Aerial platforms support safer elevated tasks, which boosts use in framing, cladding, roofing, and electrical installation. Ship and offshore sites adopt advanced lifts for hull repairs and deck operations, while equipment maintenance grows as industrial plants invest in uptime improvement. Rising safety regulations and rental fleet modernization continue to support market expansion across all end-use categories.
- For instance, the JLG 860SJ telescopic boom lift has a maximum working height of 28.21 m (92 ft) and a horizontal outreach of 22.86 m (75 ft), allowing maintenance teams to service high-rise industrial systems with reduced repositioning cycles.
 Key Growth Drivers
Rising Construction and Infrastructure Expansion
Strong growth in commercial buildings, industrial facilities, and large infrastructure upgrades fuels demand for advanced aerial equipment across the United States. Contractors prefer lifts that support safer elevation and faster project timelines, which increases adoption in framing, roofing, electrical work, and façade installation. Highway rehabilitation and bridge maintenance also boost fleet utilisation. Rental companies expand inventories to meet rising project volumes, and this wider equipment availability strengthens market momentum across both urban and suburban development zones.
- For instance, Haulotte’s HT43 RTJ Pro offers a 42.2-meter working height with a 450-kilogram load capacity, enabling crews to handle heavy tools during complex façade construction.
Shift Toward Safety Compliance and Workforce Protection
Stricter workplace safety rules increase the use of certified aerial platforms across construction and industrial sites. Firms adopt boom and scissor lifts to reduce fall risks and meet OSHA standards without slowing project efficiency. Modern lifts support stable elevation, controlled positioning, and advanced access features that improve worker confidence. Companies invest in newer models as part of safety-driven upgrades, and rental providers refresh fleets more often. This trend pushes wider adoption of reliable and regulation-ready aerial platforms nationwide.
- For instance, the Skyjack SJIII 3226 electric scissor lift has a maximum working height of 9.92 m (32.5 ft), which is approximately 9.9 meters.
Expansion of Rental-Based Equipment Models
The rising preference for rental sourcing boosts market growth as businesses shift away from high-capital purchases. Rental fleets offer flexible access to multiple lift types, helping users match equipment to project demands without long-term ownership costs. Large rental firms invest in high-performance and energy-efficient lifts to attract frequent users. Small contractors and seasonal projects also rely on short-term rentals, supporting strong turnover rates. This model increases equipment availability and deepens market penetration across diverse end-use sectors.
Key Trends & Opportunities
Adoption of Electrified and Low-Emission Aerial Platforms
Demand for electric and hybrid lifts grows as companies follow environmental rules and reduce site emissions. These platforms operate quietly, which benefits indoor work and urban projects with noise limits. Longer battery cycles, fast-charging systems, and improved power management strengthen the shift toward clean equipment. Contractors and rental firms update fleets with sustainable options to meet customer expectations. This transition opens opportunities for manufacturers focused on energy-efficient and maintenance-friendly models.
- For instance, the Niftylift HR17N Hybrid and all-electric (E) models use a super-efficient 48-volt battery system.
Integration of Telematics and Smart Fleet Management
Advanced telematics tools allow users to track lift performance, location, and maintenance needs with real-time precision. Rental companies benefit from faster diagnostics and reduced downtime, while operators gain safer control settings. Digital platforms help optimise fleet deployment based on usage patterns. Construction firms prefer lifts that offer predictive alerts and remote monitoring because these features reduce repair delays. The trend accelerates adoption of connected equipment and creates new opportunities for value-added digital services.
- For instance, the Snorkel 2100SJ telescopic boom lift has a maximum platform height of 64.0 m and a maximum working height of 66.0 m (216.5 ft).
Expansion of High-Reach and Specialised Platforms
Growing demand for tall structures, renewable energy sites, and large industrial complexes creates space for specialised long-reach lifts. Telescopic and articulating models support safe access in utility, refinery, and bridge projects. Manufacturers develop compact yet high-reach designs suited for tight urban zones. This shift boosts innovation in stabilisation systems, load capacity, and height extensions. As project complexity increases, equipment with higher reach and precise movement becomes a key opportunity for manufacturers and rental providers.
Key Challenges
High Maintenance Costs and Frequent Downtime Risk
Aerial equipment requires regular inspection, part replacement, and safe-operation checks, which increase running costs for owners and rental companies. Complex mechanical and hydraulic systems may lead to downtime when repairs take longer than expected. These delays affect project schedules and reduce equipment utilisation rates. Smaller contractors often face cost pressure when relying on older machines. Managing long-term maintenance efficiency remains a major challenge that impacts profitability and fleet reliability.
Skilled Operator Shortage and Training Gaps
The market faces a shortage of trained lift operators who can handle advanced platforms safely. Many job sites rely on temporary labour, which increases safety risks and slows equipment productivity. Training programs are expanding, but high turnover limits consistent skill development. Operators must understand platform controls, weight limits, and movement stability to avoid accidents. This skill gap makes it harder for companies to deploy large fleets efficiently and raises liability concerns for many end users.
Regional Analysis
New York
New York holds about 24% of the U.S. Aerial Equipment Market share due to its dense construction activity, high-rise development, and continuous infrastructure upgrades. The city relies heavily on boom and scissor lifts for façade work, electrical installation, and bridge maintenance across its extensive urban footprint. Strong rental penetration supports rapid access to equipment for short-cycle projects. Warehouse expansion in surrounding counties boosts vertical lift demand. Ongoing upgrades in transit systems and commercial hubs increase fleet utilisation, making New York one of the largest and most stable contributors to national aerial equipment demand.
Los Angeles
Los Angeles accounts for nearly 18% of the market share, driven by strong demand in commercial construction, port operations, and large industrial maintenance projects. The city’s extensive film studios, logistics centers, and ongoing transportation upgrades increase usage of aerial platforms for elevated tasks. Electric and hybrid lifts gain traction due to strict regional emissions rules. Expansion of distribution hubs around the metro area increases adoption of compact vertical and scissor lifts. Consistent investment in airport expansion and coastal infrastructure keeps Los Angeles a major consumer of advanced aerial equipment solutions.
Chicago
Chicago holds about 14% of the market share, supported by active building renovation, high-rise maintenance, and large infrastructure repair programs tied to rail and road systems. Industrial zones and manufacturing facilities rely on aerial platforms for routine maintenance, which stabilizes equipment turnover. Cold-weather durability and reliable indoor lifts are key focus areas for local contractors. Strong demand from warehouse clusters around the metro area boosts use of compact lifts. The city’s balanced mix of commercial, industrial, and municipal work keeps Chicago an important hub for aerial equipment rentals and fleet expansion.
Houston
Houston represents nearly 12% of the market share, driven by significant demand from the energy sector, petrochemical plants, and large industrial complexes. Aerial platforms support elevated inspections, maintenance, and structural work across massive refinery operations. Commercial construction and suburban expansion also contribute to steady lift utilization. The city’s wide-area industrial facilities fuel demand for long-reach boom lifts and heavy-duty platforms. Strong equipment rotation within rental fleets supports rapid deployment for short-term projects. Houston’s industrial backbone and continuous expansion across utilities and logistics hubs make it a key contributor to national demand.
Atlanta
Atlanta accounts for about 9% of the market share, supported by rapid commercial development, transportation upgrades, and strong warehouse construction driven by the city’s logistics leadership. Aerial platforms are widely used for roofing, electrical installation, and structural framing across expanding business districts. The city’s growing distribution centers boost adoption of vertical and scissor lifts. Rental companies maintain diverse fleets to serve mixed industrial and commercial demand. With continued population growth and expanding infrastructure programs, Atlanta maintains a rising share and remains one of the fastest-growing urban markets for aerial equipment adoption.
Market Segmentations:
By Aerial Work Platform
- Boom Lifts
- Scissor Lifts
- Vertical Lifts
- Telescopic Lifts
By Application
- Construction
- Ship & Offshore
- Equipment Maintenance
By Geography
- New York
- Los Angeles
- Chicago
- Houston
- Atlanta
Competitive Landscape
Haulotte Group, Teupen USA, Terex Corporation, Manitex International, Skyjack, Snorkel International, Morbark LLC, ReachMaster, Aichi Corporation, and JLG Industries form the core competitive environment in the United States Aerial Equipment Market. The landscape features strong rivalry across boom lifts, scissor lifts, vertical lifts, and specialised platforms as companies focus on improving performance, reliability, and operator safety. Manufacturers accelerate product development to meet rising demand for electric, hybrid, and low-emission models while enhancing durability for industrial and infrastructure projects. Rental fleet partnerships remain central as suppliers expand distribution reach and strengthen service networks. Advancements in telematics, safety controls, and lightweight structural designs help differentiate offerings. Competition intensifies with growing customer expectations for efficient maintenance support, quick equipment availability, and reduced downtime. Firms invest in training programs, after-sales capabilities, and digital monitoring tools to improve site productivity and maintain a strong position within a rapidly modernising market.
Key Player Analysis
- Haulotte Group
- Teupen USA
- Terex Corporation
- Manitex International
- Skyjack
- Snorkel International
- Morbark LLC
- ReachMaster
- Aichi Corporation
- JLG Industries
Recent Developments
- In 2025, JLG updated its rotating telehandler line, introducing the R13100 model with a 13,200-lb capacity and 97-ft lift height. which enhances heavy lifting capability.
- In 2025, Terex Utilities launched the TRX Series of telescopic aerial devices at the 2025 Utility Expo. The TRX41 bucket truck design increases lifting capacity and payload while remaining under the CDL threshold for operators.
- In 2024, Snorkel launched its A62JRT articulating boom lift with a 20.8m working height, zero tail swing, a large platform, and 11.1m outreach, suitable for rough terrain and demanding job sites.
Report Coverage
The research report offers an in-depth analysis based on Aerial Work Platform, Application and Geography. It details leading market players, providing an overview of their business, product offerings, investments, revenue streams, and key applications. Additionally, the report includes insights into the competitive environment, SWOT analysis, current market trends, as well as the primary drivers and constraints. Furthermore, it discusses various factors that have driven market expansion in recent years. The report also explores market dynamics, regulatory scenarios, and technological advancements that are shaping the industry. It assesses the impact of external factors and global economic changes on market growth. Lastly, it provides strategic recommendations for new entrants and established companies to navigate the complexities of the market.
Future Outlook
- The market will see rising adoption of electric and hybrid aerial platforms across major projects.
- Rental companies will expand smart fleets with telematics to improve utilisation and maintenance planning.
- Demand for high-reach boom lifts will grow as infrastructure and utility upgrades accelerate nationwide.
- Compact scissor and vertical lifts will gain traction in warehouses and urban construction zones.
- Safety-focused designs and automated control features will shape new equipment development.
- Manufacturers will invest in lighter materials to improve mobility and reduce energy use.
- Fleet modernisation will increase as older diesel units are replaced with low-emission models.
- Data-driven fleet optimisation will strengthen rental margins and reduce downtime.
- Growth in industrial maintenance work will support steady demand for reliable vertical access solutions.
- Partnerships between OEMs and rental providers will deepen to meet evolving project requirements.
Request a Free Sample
Fill in your details and we'll send you a free sample report.
- Sample data tables & charts
- Research methodology
Need a Custom Version of This Report?
Tailor the scope, geography, or segments to your exact requirements.
- Custom geography or segment scope
- Direct access to our analyst team
Frequently Asked Questions
What is the current market size for United States Aerial Equipment Market, and what is its projected size in 2032?
At what Compound Annual Growth Rate is the United States Aerial Equipment Market projected to grow between 2025 and 2032?
Which United States Aerial Equipment Market segment held the largest share in 2024?
What are the primary factors fueling the growth of the United States Aerial Equipment Market?
Who are the leading companies in the United States Aerial Equipment Market?
Which region commanded the largest share of the United States Aerial Equipment Market in 2024?
Table of Content
Chapter 1. Report Introduction
- 1.1 Report Description & Purpose
- 1.1.1 Report Title & Market Definition
- 1.1.2 Unique Selling Propositions (USP) & Key Differentiators
- 1.1.3 Value Proposition for Stakeholders
- 1.2 Research Objectives
- 1.2.1 Market Sizing Objectives (Volume & Revenue)
- 1.2.2 Segmentation Objectives
- 1.2.3 Competitive Intelligence Objectives
- 1.2.4 Forecast & Scenario Objectives
- 1.3 Report Scope
- 1.3.1 United States Aerial Equipment Scope – Types & Subtypes Covered
- 1.3.2 Geographic Scope – Regions & Countries Covered
- 1.3.3 Historical Period, Base Year & Forecast Period (2024; forecast to 2032)
- 1.3.4 Inclusions & Exclusions
- 1.4 HS Code & Classification Framework
- 1.5 Currency, Units & Pricing Basis
- 1.6 Target Stakeholders
- 1.7 Limitations & Assumptions
Chapter 2. Executive Summary
- 2.1 Global United States Aerial Equipment Market Snapshot
- 2.1.1 Market Size – Historical (2024) & Forecast (2024-2032) (2024: USD 2 billion → 2032: USD 3.89 billion)
- 2.1.2 Volume & Revenue – Global Totals
- 2.1.3 Key Market Highlights – Top Five Facts
- 2.2 United States Aerial Equipment Market Segmentation Snapshot
- 2.2.1 Market Split by Region – 2024 vs. 2032
- 2.3 Competitive Snapshot
- 2.3.1 Top 10 Players by Revenue Share – 2024
- 2.3.2 Top 10 Players by Volume Share – 2024
- 2.3.3 Recent Strategic Developments (18-Month Summary)
- 2.4 Key Investment Highlights & Strategic Conclusions
Chapter 3. United States Aerial Equipment Market Dynamics & Industry Analysis
- 3.1 Market Overview & Context
- 3.1.1 United States Aerial Equipment Market Position in the Broader Automotive Value Chain
- 3.1.2 OEM vs. Replacement Market Dynamics
- 3.1.3 Market Maturity & Development Stage by Region
- 3.2 United States Aerial Equipment Market Drivers
- 3.3 United States Aerial Equipment Market Restraints & Challenges
- 3.4 United States Aerial Equipment Market Opportunities
- 3.5 Porter's Five Forces Analysis
- 3.5.1 Threat of New Entrants
- 3.5.2 Bargaining Power of Suppliers
- 3.5.3 Bargaining Power of Buyers
- 3.5.4 Threat of Substitutes
- 3.5.5 Competitive Rivalry – Intensity Assessment
- 3.6 United States Aerial Equipment Value Chain Analysis
- 3.6.1 Upstream – Raw Material/Input Suppliers
- 3.6.1.1 Raw Material/Input 1
- 3.6.1.2 Raw Material/Input 2
- 3.6.1.3 Raw Material/Input 3
- 3.6.2 Midstream – Production/Manufacturing/Service Delivery
- 3.6.2.1 Production/Process Overview
- 3.6.2.2 Key Facility Locations & Capacity by Manufacturer
- 3.6.3 Downstream – Distribution & End Consumer
- 3.6.3.1 Primary Channel – B2B/OEM
- 3.6.3.2 Secondary Channels – Dealer, Retail, Online, Direct
- 3.6.4 Value Chain Profitability Analysis
- 3.6.1 Upstream – Raw Material/Input Suppliers
- 3.7 PESTEL Analysis
- 3.7.1 Political Factors
- 3.7.2 Economic Factors
- 3.7.3 Social Factors
- 3.7.4 Technological Factors
- 3.7.5 Environmental Factors
- 3.7.6 Legal Factors
- 3.8 United States Aerial Equipment Supply Chain Analysis
- 3.8.1 Raw Material/Input Supply Risk Assessment
- 3.8.2 Manufacturing Concentration Risk (Geographic Exposure)
- 3.8.3 Trade Disruption Impact Analysis
- 3.9 Regulatory & Policy Landscape
Note: The regulatory and policy landscape section covers regulations based on their applicability to the market, United States Aerial Equipment category, geography, and scope of the study. Only regulatory frameworks with a material impact on operations, compliance, trade, sustainability, or market access are analyzed in detail.
Chapter 4. Key Investment Pockets & Opportunity Analysis
- 4.1 United States Aerial Equipment Market Attractiveness Analysis
- 4.1.1 By Region – Investment Attractiveness Matrix (Volume × CAGR)
- 4.2 Absolute Revenue Growth Opportunity
- 4.2.1 By Region – Absolute USD Growth Through 2032
- 4.3 Incremental Volume Opportunity
- 4.3.1 By Region – Incremental Volume Through 2032
- 4.3.2 Segment – Incremental Volume
- 4.4 Emerging Submarket Opportunity Deep Dive (Subject to Applicability)
- 4.5 Emerging Market Opportunity Scorecards
- 4.5.1 United States
- 4.5.2 Europe
- 4.5.3 Asia
- 4.5.4 Middle East & Africa
Note: Emerging Market Opportunity Scorecards will be included based on relevance and strategic importance. Regions listed are indicative and may vary depending on data availability and market dynamics.
Chapter 5. United States Aerial Equipment Import-Export Analysis & Trade Flows
- 5.1 Global Trade Overview
- 5.1.1 Global Export Value by Country (2024)
- 5.1.2 Global Export Volume by Country (2024)
- 5.1.3 Global Import Value by Country (2024)
- 5.1.4 Global Import Volume by Country (2024)
- 5.1.5 Net Trade Balance by Country (2024)
- 5.2 Export Analysis – Segment
- 5.2.1 Type 1 (HS Code)
- 5.2.2 Type 2 (HS Code)
- 5.2.3 Type 3 (HS Code)
- 5.2.4 Type 4 (HS Code)
- 5.2.5 Type 5 (HS Code)
- 5.3 Import Analysis – Segment
- 5.3.1 Type 1 (HS Code)
- 5.3.2 Type 2 (HS Code)
- 5.3.3 Type 3 (HS Code)
- 5.3.4 Type 4 (HS Code)
- 5.3.5 Type 5 (HS Code)
- 5.4 Average Unit Trade Prices
- 5.4.1 Average Export Price – Segment & Country
- 5.4.2 Average Import Price – Segment & Source Country
- 5.4.3 Price Trends (2024)
- 5.5 Key Trade Route Analysis
- 5.5.1 Trade Route 1
- 5.5.2 Trade Route 2
- 5.5.3 Trade Route 3
- 5.5.4 Trade Route 4
- 5.5.5 Trade Route 5
- 5.6 Trade Policy Impact Assessment
- 5.6.1 US Anti-Dumping & Section 301 Tariffs
- 5.6.2 EU Customs Union Impact
- 5.6.3 Major Free Trade Agreements
- 5.6.4 USMCA Rules of Origin
Note: Trade policy analysis will be included only where relevant to the United States Aerial Equipment market.
Chapter 6. Competitive Landscape & Company Benchmarking
- 6.1 United States Aerial Equipment Market Concentration & Structure
- 6.1.1 Herfindahl-Hirschman Index (HHI) – vs. 2024
- 6.1.2 Tier 1, Tier 2 & Tier 3 Market Structure
- 6.1.3 Global, Regional & Local Player Dynamics
- 6.2 United States Aerial Equipment Market Share Analysis – 2024
- 6.2.1 Global Revenue Share by Company
- 6.2.2 Global Volume Share by Company
- 6.2.3 Regional Revenue Share
- 6.2.4 Market Share Evolution ( vs. 2024)
- 6.2.5 OEM Segment Share by Company
- 6.2.6 Replacement Segment Share by Company
- 6.3 Production/Delivery Capacity & Facility Analysis
- 6.3.1 Global Installed Capacity
- 6.3.2 Capacity Utilization Rates
- 6.3.3 Production/Output Volume
- 6.3.4 Facility Locations & Capacity Map
- 6.3.5 Planned Capacity Additions
- 6.4 United States Aerial Equipment Competitive Benchmarking Matrix
- 6.4.1 Revenue, Volume, CAGR & Profitability Comparison
- 6.4.2 Channel Revenue Mix
- 6.4.3 Geographic Revenue Exposure
- 6.4.4 R&D Intensity
- 6.4.5 Sustainability Maturity
- 6.5 Strategic Developments in United States Aerial Equipment (Last 24 Months)
- 6.5.1 Mergers, Acquisitions & Divestments
- 6.5.2 New United States Aerial Equipment Launches
- 6.5.3 Facility Expansions
- 6.5.4 Strategic Alliances, Joint Ventures & Partnerships
- 6.5.5 Distribution Expansion & Market Entry
- 6.5.6 Sustainability & ESG Initiatives
- 6.6 Competitive Strategy Mapping
- 6.6.1 Leader, Challenger, Follower & Niche Classification
- 6.6.2 Pricing Strategy Comparison
- 6.6.3 Channel Strategy Matrix
Note: Strategic developments are included based on their materiality and the availability of reliable information.
Chapter 7. Global United States Aerial Equipment Market – By Distribution Channel
- 7.1 Segment Overview
- 7.1.1 Volume & Revenue Split by Channel (2024 & 2032)
- 7.1.2 Channel Mix Evolution (2024-2032)
Chapter 8. Regional Market Analysis – Global Overview
- 8.1 Global Regional Overview
- 8.1.1 Regional Volume Share
- 8.1.2 Regional Revenue Share
- 8.1.3 Regional Volume by Region
- 8.1.4 Regional Revenue by Region
- 8.1.5 Regional Forecast Through 2032
- 8.2 Cross-Regional Segment Analysis
- 8.2.1 By Distribution Channel
- 8.2.2 By Brand/Price Tier
Chapter 9. North America United States Aerial Equipment Market
- 9.1 United States
- 9.2 Canada
- 9.3 Mexico
Chapter 10. Europe United States Aerial Equipment Market
- 10.1 Germany
- 10.2 France
- 10.3 Italy
- 10.4 United Kingdom
- 10.5 Spain
- 10.6 Poland
- 10.7 Russia
- 10.8 Netherlands
- 10.9 Belgium
- 10.10 Sweden
- 10.11 Denmark
- 10.12 Norway
- 10.13 Rest of Europe
Chapter 11. Asia Pacific United States Aerial Equipment Market
- 11.1 China
- 11.2 India
- 11.3 Japan
- 11.4 South Korea
- 11.5 Thailand
- 11.6 Indonesia
- 11.7 Vietnam
- 11.8 Malaysia
- 11.9 Australia
- 11.10 Rest of Asia Pacific
Chapter 12. Latin America United States Aerial Equipment Market
- 12.1 Brazil
- 12.2 Argentina
- 12.3 Colombia
- 12.4 Chile
- 12.5 Rest of Latin America
Chapter 13. Middle East United States Aerial Equipment Market
- 13.1 Saudi Arabia
- 13.2 United Arab Emirates
- 13.3 Turkey
- 13.4 Israel
- 13.5 Iran
- 13.6 Rest of the Middle East
Chapter 14. Africa United States Aerial Equipment Market
- 14.1 South Africa
- 14.2 Egypt
- 14.3 Nigeria
- 14.4 Morocco
- 14.5 Rest of Africa
Chapter 15. United States Aerial Equipment Company Profiles
- 15.1 [Company 01]
- 15.1.1 Company Overview
- 15.1.2 Key Management Personnel
- 15.1.3 Products & Services Portfolio
- 15.1.4 Financial Performance
- 15.1.5 Key Market Focus & Geographic Presence
- 15.1.6 Recent Developments & Strategic Initiatives
Note: The company profile list is preliminary and may change based on research findings, market developments, data availability, and client requirements.
Chapter 16. Appendices
- Appendix A – List of Abbreviations & Acronyms
- Appendix B – Industry Classification Code Reference – Full Series
- Appendix C – Production & Capacity Data Tables
- Appendix D – End-Use & Demand Base Tables
- Appendix E – Consumption & Replacement Rate Assumptions
- Appendix F – ASP Reference Tables
- Appendix G – Manufacturing & Facility Database
- Appendix H – Import-Export Data Tables
- Appendix I – Regulatory Summary Tables
- Appendix J – Primary Research Participant List (Anonymized)
- Appendix K – Primary Research Questionnaire Framework
- Appendix L – Data Sources & Bibliography
- Appendix M – Market Size Divergence & Source Comparison
Chapter 17. Research Methodology
- 17.1 Research Framework & Philosophy
- 17.2 Secondary Research – Sources, Hierarchy & Data Extraction
- 17.3 Data Modeling – Bottom-Up & Top-Down Market Sizing
- 17.4 Primary Research – Stakeholder Framework, LOI & Sample Sizes
- 17.5 Forecast Methodology – Regression, Scenario & Sensitivity Analysis
- 17.6 Quality Control – Four-Layer Validation Framework
- 17.7 Limitations & Standard Assumptions
- 17.8 Disclaimer
