
Market Overview
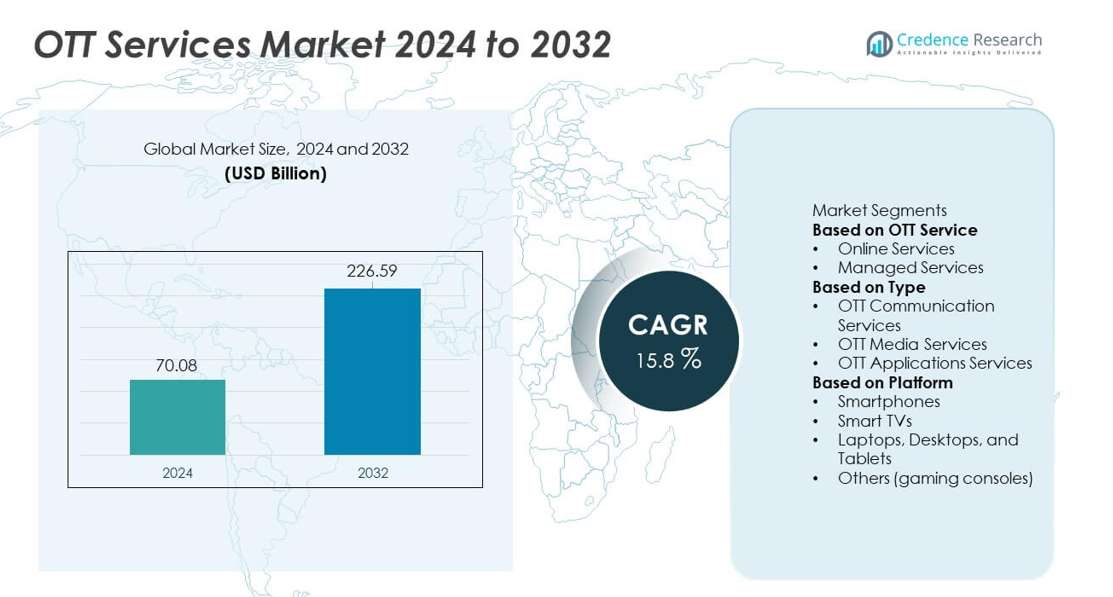
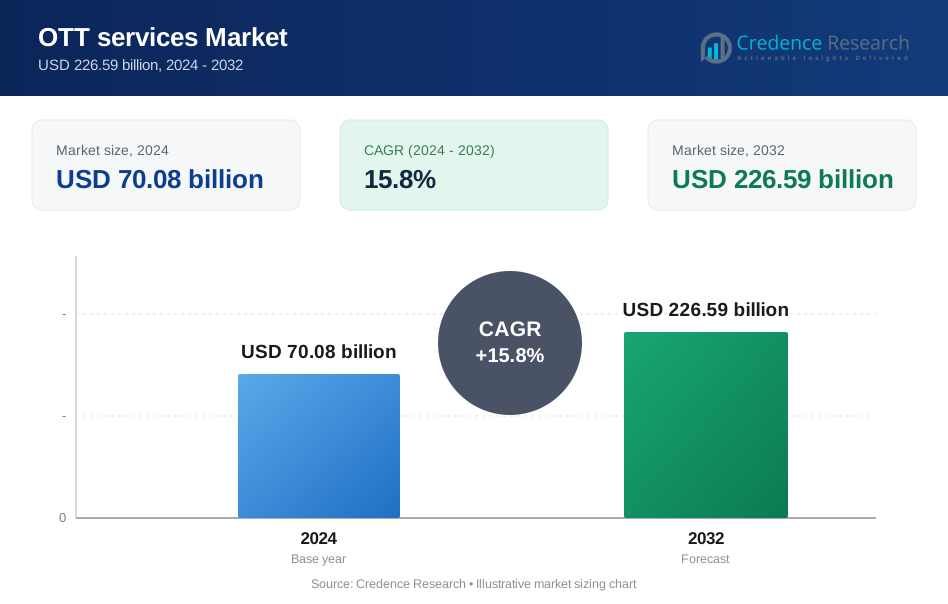
The OTT Services market size reached USD 70.08 billion in 2024 and is projected to reach USD 226.59 billion by 2032, supported by a strong 15.8% CAGR during the forecast period.
| REPORT ATTRIBUTE | DETAILS |
|---|---|
| Historical Period | 2020-2023 |
| Base Year | 2024 |
| Forecast Period | 2025-2032 |
| OTT Services MarketSize 2024 | USD 70.08 billion |
| OTT Services Market, CAGR | 15.8% |
| OTT Services Market Size 2032 | USD 226.59 billion |
Top players in the OTT Services market include Netflix, Amazon Prime Video, Disney+, Hulu, HBO Max, YouTube, Apple TV+, Hotstar, Spotify, and Tencent Video, each expanding their content libraries and digital ecosystems to strengthen global reach. These platforms compete through original productions, regional-language content, optimized user interfaces, and bundled subscription models. Strong partnerships with telecom operators and smart device manufacturers further enhance accessibility across diverse consumer groups. North America leads the market with a 39% share, supported by high broadband penetration and strong demand for premium streaming services, while Europe and Asia Pacific continue to expand rapidly due to rising digital adoption and increasing investment in localized content.
Market Insights
- The OTT Services market reached USD 70.08 billion in 2024 and is set to grow at a 15.8% CAGR, driven by expanding digital consumption across global markets.
- Strong growth comes from rising demand for personalized streaming, original productions, and flexible subscription models supported by high-speed internet and 5G rollout.
- Key trends include AI-based recommendations, regional-language content expansion, hybrid monetization models, and multi-device integration that strengthens competitive positioning for major players.
- Market restraints include high content production costs, subscriber churn, and growing regulatory scrutiny related to data privacy and content distribution.
- North America leads the market with a 39% share, followed by Europe at 27% and Asia Pacific at 26%, while OTT media services dominate the type segment with a 72% share, and smartphones lead the platform segment with a 57% share due to strong mobile-first viewing habits.
Market Segmentation Analysis:
By OTT Service
Online services lead the segment with a 68% share, driven by strong adoption of subscription-based streaming, video-on-demand platforms, and digital content libraries. Consumers prefer online OTT services for their flexibility, multi-device access, and low entry barriers. Managed services continue to grow as enterprises and media firms outsource content delivery, analytics, and platform management to ensure seamless user experiences. Expanding broadband penetration, rising demand for high-quality streaming, and the shift from traditional cable networks strengthen the dominance of online OTT services across global markets.
- For instance, Netflix expanded its content library, supported by upgrades to its global CDN that improved delivery efficiency and quality of experience for its millions of global members.
By Type
OTT media services dominate the segment with a 72% share, supported by rising demand for movies, web series, sports streaming, and exclusive digital content. Major platforms invest heavily in original productions and regional language libraries to attract diverse audiences. OTT communication services maintain steady growth due to increasing adoption of internet-based messaging and calling applications. OTT application services expand with cloud gaming, e-learning, and utility-based digital tools. Growing digital consumption, enhanced mobile connectivity, and rapid platform innovation reinforce the leadership of media-focused OTT services.
- For instance, Amazon Prime Video produces a significant amount of original content across global markets and uses its AWS-powered transcoding pipeline to process video files efficiently. The service also scales its live-streaming infrastructure to support a large global audience during major events, leveraging AWS to deliver a reliable, low-latency viewing experience.
By Platform
Smartphones hold the dominant position with a 57% share, driven by widespread mobile internet access, affordable data plans, and the rising popularity of short-form and on-the-go entertainment. Smart TVs follow as households shift toward large-screen streaming and connected home entertainment ecosystems. Laptops, desktops, and tablets support multitasking and premium content viewing, especially for long-form content. Gaming consoles contribute niche demand through integrated streaming apps. Increasing mobile penetration, 5G rollout, and AI-driven personalization continue to strengthen the dominance of smartphone-based OTT consumption globally.
Key Growth Drivers
Rising Demand for On-Demand and Personalised Content
Growing consumer preference for flexible, on-demand entertainment drives strong adoption of OTT platforms. Users seek personalized viewing experiences supported by AI-based recommendations, multilingual content, and device-agnostic access. Streaming platforms invest in exclusive originals, regional content hubs, and premium subscriptions to attract broader audiences. Cord-cutting trends accelerate the shift from traditional pay-TV to digital streaming ecosystems. Expanded screen availability across smartphones, smart TVs, and tablets further strengthens consumption. These factors collectively fuel sustained OTT market growth.
- For instance, YouTube's recommendation system analyses a vast array of daily signals to refine viewer suggestions and processes immense volumes of uploaded video continuously. The platform's global CDN delivers peak traffic loads that handle substantial network demands.
Rapid Internet Penetration and 5G Deployment
Expanding broadband connectivity and the rollout of 5G significantly improve streaming quality and platform accessibility. High-speed networks support HD, 4K, and live streaming with reduced buffering and enhanced user experience. Emerging markets benefit from affordable data plans that encourage mass OTT adoption. Telecom operators partner with OTT platforms to bundle subscriptions, expanding reach across diverse customer segments. Enhanced network capabilities also enable interactive content and cloud-based applications. Faster and more reliable internet infrastructure serves as a core driver of OTT market expansion.
- For instance, Airtel's 5G network recorded strong peak speeds during initial testing and has undertaken significant upgrades across its mobile sites. The company also began integrating network APIs that allow partners to enhance service responsiveness by reducing network delay.
Growing Integration of OTT Services in Entertainment Ecosystems
OTT platforms increasingly integrate with smart devices, home entertainment systems, and gaming platforms, improving accessibility and engagement. Partnerships between broadcasters, telecom providers, and streaming services expand cross-platform content delivery. Live sports, digital events, and hybrid entertainment formats attract significant viewership. Content creators and studios use OTT channels to bypass traditional distribution, reducing cost and increasing reach. This interconnected digital ecosystem strengthens the role of OTT as a central entertainment medium across global markets.
Key Trends & Opportunities
Expansion of Regional and Multilingual Content Libraries
OTT platforms focus on regional storytelling and local-language programming to capture diverse audience groups. Demand for culturally relevant content grows across Asia, Latin America, and Africa, creating strong opportunities for localized productions. Platforms invest in subtitles, dubbing, and hyperlocal narratives to increase engagement. Smaller creators and independent studios gain visibility through OTT distribution. This trend opens significant growth potential as regional content consumption continues to rise.
- For instance, Disney+ Hotstar expanded its South Asian library by regularly adding more regional titles and scaling its dubbing operations to support a variety of Indian languages, including Hindi, Tamil, Telugu, Bengali, Kannada, Malayalam, and Marathi.
Growth of Ad-Supported and Hybrid Monetization Models
Ad-supported video-on-demand (AVOD) and hybrid subscription models gain traction as users seek affordable streaming options. Brands leverage targeted advertising powered by user analytics to enhance campaign impact. OTT platforms diversify revenue streams by combining subscriptions, ads, and transactional purchases. This model increases accessibility for price-sensitive markets and expands the advertiser base. As competition intensifies, flexible pricing and ad-driven strategies create strong growth opportunities.
- For instance, Hulu's ad-tech system delivers a significant volume of ad impressions monthly and analyzes viewer profiles to refine targeting accuracy. The platform's dynamic ad insertion engine processes ad-placement decisions continuously during peak hours, ensuring a seamless, TV-like experience without latency between content and ads.
Key Challenges
High Content Production Costs and Intense Competition
Producing exclusive and high-quality content requires significant investment in studios, talent, and technology. Established platforms compete for premium rights, driving costs even higher. Smaller providers struggle to match the scale of global competitors. Intense rivalry also increases subscriber churn as users switch between platforms. These factors create ongoing financial pressure across the OTT industry.
Data Privacy Concerns and Regulatory Compliance
OTT platforms handle large amounts of user data related to viewing habits, personal profiles, and payments. Increasing scrutiny from regulators around data protection, content moderation, and cross-border streaming adds compliance challenges. Platforms must invest in cybersecurity, transparent policies, and content rating systems. Failure to meet regulatory standards can result in service restrictions or penalties.
Regional Analysis
North America
North America leads the OTT Services market with a 39% share, supported by high broadband penetration, mature digital infrastructure, and strong demand for premium subscription platforms. The United States drives growth through extensive adoption of video-on-demand, live sports streaming, and bundled offerings from telecom and media companies. Consumers show strong preference for original content and multi-platform viewing, boosting investment in exclusive productions. Smart TV integration and widespread smartphone usage further support engagement. Canada contributes steady demand through growing cord-cutting trends and expanding local-language streaming libraries.
Europe
Europe holds a 27% share, driven by rapid adoption of digital entertainment, strong telecom partnerships, and rising consumption of multilingual OTT content. Countries such as the United Kingdom, Germany, France, and Italy lead the region with widespread smart TV usage and high-speed broadband access. Strict data privacy and content regulations shape platform strategies, pushing investments in localized content and secure streaming frameworks. Increased spending on regional productions and EU content quotas positively influence viewership. Growing interest in ad-supported models and hybrid subscription formats strengthens the region’s OTT growth.
Asia Pacific
Asia Pacific accounts for a 26% share, fueled by rising smartphone penetration, affordable data plans, and booming demand for regional-language content. India and China dominate the market with large digital populations and strong adoption of mobile-first streaming formats. Southeast Asia adds significant momentum through expanding internet access and growing interest in sports, entertainment, and short-form content. Major OTT platforms invest heavily in local productions and partnerships with telecom operators to expand reach. Rapid urbanization and the rollout of 5G networks further strengthen the region’s position as a high-growth OTT market.
Latin America
Latin America holds a 5% share, supported by rising digital adoption, growing middle-class consumption, and expanding interest in international and regional OTT content. Brazil and Mexico drive market growth through increasing smartphone usage and improved broadband capacity. Local-language productions gain strong traction, encouraging global platforms to invest in regional studios. Economic fluctuations create pricing challenges, but ad-supported and hybrid models help expand user access. The growth of smart TVs and affordable mobile plans continues to boost streaming activity across urban areas.
Middle East & Africa
The Middle East & Africa region accounts for a 3% share, driven by expanding digital infrastructure, rising youth population, and growing demand for mobile-based entertainment. Gulf countries such as the UAE and Saudi Arabia lead adoption through high-income households and strong smart device penetration. Local and international platforms invest in Arabic-language content and partnerships with telecom operators to enhance accessibility. In Africa, rising smartphone ownership and improving internet availability support steady growth. Despite economic constraints in some areas, the region shows increasing long-term potential for OTT expansion.
Market Segmentations:
By OTT Service
- Online Services
- Managed Services
By Type
- OTT Communication Services
- OTT Media Services
- OTT Applications Services
By Platform
- Smartphones
- Smart TVs
- Laptops, Desktops, and Tablets
- Others (gaming consoles)
By Geography
- North America
- U.S.
- Canada
- Mexico
- Europe
- Germany
- France
- U.K.
- Italy
- Spain
- Rest of Europe
- Asia Pacific
- China
- Japan
- India
- South Korea
- South-east Asia
- Rest of Asia Pacific
- Latin America
- Brazil
- Argentina
- Rest of Latin America
- Middle East & Africa
- GCC Countries
- South Africa
- Rest of the Middle East and Africa
Competitive Landscape
Major players in the OTT Services market include Netflix, Amazon Prime Video, Disney+, Hulu, HBO Max, YouTube, Apple TV+, Spotify, Hotstar, and Tencent Video. These companies compete by expanding global content libraries, investing in high-quality originals, and enhancing user experience through AI-driven recommendations and multi-device compatibility. Leading platforms strengthen their reach through partnerships with telecom operators, device manufacturers, and smart TV brands. Many players adopt hybrid models, combining subscription and ad-supported offerings to attract diverse customer segments. Regional-language content production accelerates as platforms target fast-growing markets across Asia, Latin America, and the Middle East. Continuous advancements in streaming technology, including 4K, HDR, and cloud-based delivery, support competitive differentiation. As competition intensifies, companies focus on reducing churn, optimizing pricing strategies, and expanding exclusive content portfolios to maintain strong market positioning.
Key Player Analysis
- Netflix
- Amazon Prime Video
- Disney+
- Hulu
- HBO Max
- YouTube
- Apple TV+
- Spotify
- Hotstar
- Tencent Video
Recent Developments
- In December 2025, Amazon Prime Video released Season 2 of Fallout plus a batch of Christmas-themed movies and sports programming.
- In November 2025, Hulu was part of a bundle offer with Disney+ during Black Friday / Cyber Monday deals.
- In October 2025, with an automatic update rollout extending into November 2025, Spotify launched a redesigned Apple TV app.
Report Coverage
The research report offers an in-depth analysis based on OTT Service, Type, Platform and Geography. It details leading market players, providing an overview of their business, product offerings, investments, revenue streams, and key applications. Additionally, the report includes insights into the competitive environment, SWOT analysis, current market trends, as well as the primary drivers and constraints. Furthermore, it discusses various factors that have driven market expansion in recent years. The report also explores market dynamics, regulatory scenarios, and technological advancements that are shaping the industry. It assesses the impact of external factors and global economic changes on market growth. Lastly, it provides strategic recommendations for new entrants and established companies to navigate the complexities of the market.
Future Outlook
- Demand for personalized and multilingual content will continue to rise across global markets.
- Adoption of ad-supported and hybrid subscription models will expand user reach.
- 5G rollout will enhance streaming quality and support new interactive viewing formats.
- Platforms will invest more in regional productions to strengthen local audience engagement.
- Smart TVs and connected home ecosystems will drive higher large-screen consumption.
- AI-driven content recommendations will improve user experience and reduce churn.
- Partnerships between telecom operators and OTT platforms will increase bundled offerings.
- Cloud gaming and interactive content will emerge as new growth avenues.
- Data privacy regulations will shape platform strategies and content management.
- Competition will intensify, pushing platforms to diversify revenue streams and enhance loyalty programs.
Request a Free Sample
Fill in your details and we'll send you a free sample report.
- Sample data tables & charts
- Research methodology
Need a Custom Version of This Report?
Tailor the scope, geography, or segments to your exact requirements.
- Custom geography or segment scope
- Direct access to our analyst team
Frequently Asked Questions
What is the current market size for OTT Services market, and what is its projected size in 2032?
t what Compound Annual Growth Rate is the OTT Services market projected to grow between 2025 and 2032?
Which segment is leading the market in terms of distribution models?
Which business models segment is estimated to have the highest CAGR throughout the forecast period?
Who are the leading companies in the OTT Services market?
Table of Content
Chapter 1. Report Introduction
- 1.1 Report Description & Purpose
- 1.1.1 Report Title & Market Definition
- 1.1.2 Unique Selling Propositions (USP) & Key Differentiators
- 1.1.3 Value Proposition for Stakeholders
- 1.2 Research Objectives
- 1.2.1 Market Sizing Objectives (Volume & Revenue)
- 1.2.2 Segmentation Objectives
- 1.2.3 Competitive Intelligence Objectives
- 1.2.4 Forecast & Scenario Objectives
- 1.3 Report Scope
- 1.3.1 OTT services Scope – Types & Subtypes Covered
- 1.3.2 Geographic Scope – Regions & Countries Covered
- 1.3.3 Historical Period, Base Year & Forecast Period (2024; forecast to 2032)
- 1.3.4 Inclusions & Exclusions
- 1.4 HS Code & Classification Framework
- 1.5 Currency, Units & Pricing Basis
- 1.6 Target Stakeholders
- 1.7 Limitations & Assumptions
Chapter 2. Executive Summary
- 2.1 Global OTT services Market Snapshot
- 2.1.1 Market Size – Historical (2024) & Forecast (2024-2032) (2024: USD 70.08 billion → 2032: USD 226.59 billion)
- 2.1.2 Volume & Revenue – Global Totals
- 2.1.3 Key Market Highlights – Top Five Facts
- 2.2 OTT services Market Segmentation Snapshot
- 2.2.1 Market Split by Region – 2024 vs. 2032
- 2.3 Competitive Snapshot
- 2.3.1 Top 10 Players by Revenue Share – 2024
- 2.3.2 Top 10 Players by Volume Share – 2024
- 2.3.3 Recent Strategic Developments (18-Month Summary)
- 2.4 Key Investment Highlights & Strategic Conclusions
Chapter 3. OTT services Market Dynamics & Industry Analysis
- 3.1 Market Overview & Context
- 3.1.1 OTT services Market Position in the Broader Automotive Value Chain
- 3.1.2 OEM vs. Replacement Market Dynamics
- 3.1.3 Market Maturity & Development Stage by Region
- 3.2 OTT services Market Drivers
- 3.3 OTT services Market Restraints & Challenges
- 3.4 OTT services Market Opportunities
- 3.5 Porter's Five Forces Analysis
- 3.5.1 Threat of New Entrants
- 3.5.2 Bargaining Power of Suppliers
- 3.5.3 Bargaining Power of Buyers
- 3.5.4 Threat of Substitutes
- 3.5.5 Competitive Rivalry – Intensity Assessment
- 3.6 OTT services Value Chain Analysis
- 3.6.1 Upstream – Raw Material/Input Suppliers
- 3.6.1.1 Raw Material/Input 1
- 3.6.1.2 Raw Material/Input 2
- 3.6.1.3 Raw Material/Input 3
- 3.6.2 Midstream – Production/Manufacturing/Service Delivery
- 3.6.2.1 Production/Process Overview
- 3.6.2.2 Key Facility Locations & Capacity by Manufacturer
- 3.6.3 Downstream – Distribution & End Consumer
- 3.6.3.1 Primary Channel – B2B/OEM
- 3.6.3.2 Secondary Channels – Dealer, Retail, Online, Direct
- 3.6.4 Value Chain Profitability Analysis
- 3.6.1 Upstream – Raw Material/Input Suppliers
- 3.7 PESTEL Analysis
- 3.7.1 Political Factors
- 3.7.2 Economic Factors
- 3.7.3 Social Factors
- 3.7.4 Technological Factors
- 3.7.5 Environmental Factors
- 3.7.6 Legal Factors
- 3.8 OTT services Supply Chain Analysis
- 3.8.1 Raw Material/Input Supply Risk Assessment
- 3.8.2 Manufacturing Concentration Risk (Geographic Exposure)
- 3.8.3 Trade Disruption Impact Analysis
- 3.9 Regulatory & Policy Landscape
Note: The regulatory and policy landscape section covers regulations based on their applicability to the market, OTT services category, geography, and scope of the study. Only regulatory frameworks with a material impact on operations, compliance, trade, sustainability, or market access are analyzed in detail.
Chapter 4. Key Investment Pockets & Opportunity Analysis
- 4.1 OTT services Market Attractiveness Analysis
- 4.1.1 By Region – Investment Attractiveness Matrix (Volume × CAGR)
- 4.2 Absolute Revenue Growth Opportunity
- 4.2.1 By Region – Absolute USD Growth Through 2032
- 4.3 Incremental Volume Opportunity
- 4.3.1 By Region – Incremental Volume Through 2032
- 4.3.2 Segment – Incremental Volume
- 4.4 Emerging Submarket Opportunity Deep Dive (Subject to Applicability)
- 4.5 Emerging Market Opportunity Scorecards
- 4.5.1 United States
- 4.5.2 Europe
- 4.5.3 Asia
- 4.5.4 Middle East & Africa
Note: Emerging Market Opportunity Scorecards will be included based on relevance and strategic importance. Regions listed are indicative and may vary depending on data availability and market dynamics.
Chapter 5. OTT services Import-Export Analysis & Trade Flows
- 5.1 Global Trade Overview
- 5.1.1 Global Export Value by Country (2024)
- 5.1.2 Global Export Volume by Country (2024)
- 5.1.3 Global Import Value by Country (2024)
- 5.1.4 Global Import Volume by Country (2024)
- 5.1.5 Net Trade Balance by Country (2024)
- 5.2 Export Analysis – Segment
- 5.2.1 Type 1 (HS Code)
- 5.2.2 Type 2 (HS Code)
- 5.2.3 Type 3 (HS Code)
- 5.2.4 Type 4 (HS Code)
- 5.2.5 Type 5 (HS Code)
- 5.3 Import Analysis – Segment
- 5.3.1 Type 1 (HS Code)
- 5.3.2 Type 2 (HS Code)
- 5.3.3 Type 3 (HS Code)
- 5.3.4 Type 4 (HS Code)
- 5.3.5 Type 5 (HS Code)
- 5.4 Average Unit Trade Prices
- 5.4.1 Average Export Price – Segment & Country
- 5.4.2 Average Import Price – Segment & Source Country
- 5.4.3 Price Trends (2024)
- 5.5 Key Trade Route Analysis
- 5.5.1 Trade Route 1
- 5.5.2 Trade Route 2
- 5.5.3 Trade Route 3
- 5.5.4 Trade Route 4
- 5.5.5 Trade Route 5
- 5.6 Trade Policy Impact Assessment
- 5.6.1 US Anti-Dumping & Section 301 Tariffs
- 5.6.2 EU Customs Union Impact
- 5.6.3 Major Free Trade Agreements
- 5.6.4 USMCA Rules of Origin
Note: Trade policy analysis will be included only where relevant to the OTT services market.
Chapter 6. Competitive Landscape & Company Benchmarking
- 6.1 OTT services Market Concentration & Structure
- 6.1.1 Herfindahl-Hirschman Index (HHI) – vs. 2024
- 6.1.2 Tier 1, Tier 2 & Tier 3 Market Structure
- 6.1.3 Global, Regional & Local Player Dynamics
- 6.2 OTT services Market Share Analysis – 2024
- 6.2.1 Global Revenue Share by Company
- 6.2.2 Global Volume Share by Company
- 6.2.3 Regional Revenue Share
- 6.2.4 Market Share Evolution ( vs. 2024)
- 6.2.5 OEM Segment Share by Company
- 6.2.6 Replacement Segment Share by Company
- 6.3 Production/Delivery Capacity & Facility Analysis
- 6.3.1 Global Installed Capacity
- 6.3.2 Capacity Utilization Rates
- 6.3.3 Production/Output Volume
- 6.3.4 Facility Locations & Capacity Map
- 6.3.5 Planned Capacity Additions
- 6.4 OTT services Competitive Benchmarking Matrix
- 6.4.1 Revenue, Volume, CAGR & Profitability Comparison
- 6.4.2 Channel Revenue Mix
- 6.4.3 Geographic Revenue Exposure
- 6.4.4 R&D Intensity
- 6.4.5 Sustainability Maturity
- 6.5 Strategic Developments in OTT services (Last 24 Months)
- 6.5.1 Mergers, Acquisitions & Divestments
- 6.5.2 New OTT services Launches
- 6.5.3 Facility Expansions
- 6.5.4 Strategic Alliances, Joint Ventures & Partnerships
- 6.5.5 Distribution Expansion & Market Entry
- 6.5.6 Sustainability & ESG Initiatives
- 6.6 Competitive Strategy Mapping
- 6.6.1 Leader, Challenger, Follower & Niche Classification
- 6.6.2 Pricing Strategy Comparison
- 6.6.3 Channel Strategy Matrix
Note: Strategic developments are included based on their materiality and the availability of reliable information.
Chapter 7. Global OTT services Market – By Distribution Channel
- 7.1 Segment Overview
- 7.1.1 Volume & Revenue Split by Channel (2024 & 2032)
- 7.1.2 Channel Mix Evolution (2024-2032)
Chapter 8. Regional Market Analysis – Global Overview
- 8.1 Global Regional Overview
- 8.1.1 Regional Volume Share
- 8.1.2 Regional Revenue Share
- 8.1.3 Regional Volume by Region
- 8.1.4 Regional Revenue by Region
- 8.1.5 Regional Forecast Through 2032
- 8.2 Cross-Regional Segment Analysis
- 8.2.1 By Distribution Channel
- 8.2.2 By Brand/Price Tier
Chapter 9. North America OTT services Market
- 9.1 United States
- 9.2 Canada
- 9.3 Mexico
Chapter 10. Europe OTT services Market
- 10.1 Germany
- 10.2 France
- 10.3 Italy
- 10.4 United Kingdom
- 10.5 Spain
- 10.6 Poland
- 10.7 Russia
- 10.8 Netherlands
- 10.9 Belgium
- 10.10 Sweden
- 10.11 Denmark
- 10.12 Norway
- 10.13 Rest of Europe
Chapter 11. Asia Pacific OTT services Market
- 11.1 China
- 11.2 India
- 11.3 Japan
- 11.4 South Korea
- 11.5 Thailand
- 11.6 Indonesia
- 11.7 Vietnam
- 11.8 Malaysia
- 11.9 Australia
- 11.10 Rest of Asia Pacific
Chapter 12. Latin America OTT services Market
- 12.1 Brazil
- 12.2 Argentina
- 12.3 Colombia
- 12.4 Chile
- 12.5 Rest of Latin America
Chapter 13. Middle East OTT services Market
- 13.1 Saudi Arabia
- 13.2 United Arab Emirates
- 13.3 Turkey
- 13.4 Israel
- 13.5 Iran
- 13.6 Rest of the Middle East
Chapter 14. Africa OTT services Market
- 14.1 South Africa
- 14.2 Egypt
- 14.3 Nigeria
- 14.4 Morocco
- 14.5 Rest of Africa
Chapter 15. OTT services Company Profiles
- 15.1 [Company 01]
- 15.1.1 Company Overview
- 15.1.2 Key Management Personnel
- 15.1.3 Products & Services Portfolio
- 15.1.4 Financial Performance
- 15.1.5 Key Market Focus & Geographic Presence
- 15.1.6 Recent Developments & Strategic Initiatives
Note: The company profile list is preliminary and may change based on research findings, market developments, data availability, and client requirements.
Chapter 16. Appendices
- Appendix A – List of Abbreviations & Acronyms
- Appendix B – Industry Classification Code Reference – Full Series
- Appendix C – Production & Capacity Data Tables
- Appendix D – End-Use & Demand Base Tables
- Appendix E – Consumption & Replacement Rate Assumptions
- Appendix F – ASP Reference Tables
- Appendix G – Manufacturing & Facility Database
- Appendix H – Import-Export Data Tables
- Appendix I – Regulatory Summary Tables
- Appendix J – Primary Research Participant List (Anonymized)
- Appendix K – Primary Research Questionnaire Framework
- Appendix L – Data Sources & Bibliography
- Appendix M – Market Size Divergence & Source Comparison
Chapter 17. Research Methodology
- 17.1 Research Framework & Philosophy
- 17.2 Secondary Research – Sources, Hierarchy & Data Extraction
- 17.3 Data Modeling – Bottom-Up & Top-Down Market Sizing
- 17.4 Primary Research – Stakeholder Framework, LOI & Sample Sizes
- 17.5 Forecast Methodology – Regression, Scenario & Sensitivity Analysis
- 17.6 Quality Control – Four-Layer Validation Framework
- 17.7 Limitations & Standard Assumptions
- 17.8 Disclaimer
