
| REPORT ATTRIBUTE | DETAILS |
|---|---|
| Historical Period | 2019-2022 |
| Base Year | 2023 |
| Forecast Period | 2024-2032 |
| Blue Ammonia Market Size 2023 | USD 74.42 million |
| Blue Ammonia Market, CAGR | 6.2% |
| Blue Ammonia Market Size 2032 | USD 127.16 million |
Market Overview
The blue ammonia market is projected to experience significant growth, soaring from USD 74.42 million in 2023 to an impressive USD 127.16 million by 2032, marking a staggering increase of 6.2%. The global energy landscape is currently experiencing a profound transformation as societies worldwide increasingly prioritize sustainability and decarbonization efforts. In this context, the Blue Ammonia Market emerges as a pivotal player, offering a promising pathway to reduce carbon emissions across various sectors. Blue ammonia, derived from natural gas or other fossil fuels with carbon capture and storage (CCS) technology, presents a significant advantage over conventional ammonia production methods by substantially mitigating greenhouse gas emissions. As industries seek cleaner alternatives amidst escalating environmental concerns, the versatility of ammonia as a fuel, fertilizer, and chemical feedstock contributes to its growing demand in agriculture, transportation, and energy sectors.
Driving the Blue Ammonia Market are escalating environmental concerns and the imperative to curb carbon emissions. With heightened awareness of the adverse effects of greenhouse gases on climate change, industries are increasingly seeking cleaner alternatives to traditional processes. Blue ammonia, produced through CCS technology, presents a compelling solution to this challenge. Moreover, strategic collaborations and partnerships between industry players, research institutions, and government agencies are fostering innovation and knowledge sharing in ammonia production and utilization. Rising investments in carbon capture and storage infrastructure further bolster the growth of the blue ammonia sector as governments, corporations, and investors allocate substantial resources to develop and scale up CCS technologies.
However, the Blue Ammonia Market also faces notable challenges hindering its widespread adoption. High upfront costs associated with implementing carbon capture and storage infrastructure pose a significant barrier, especially in regions with limited financial resources or regulatory support. Additionally, technological barriers, such as optimizing carbon capture efficiency and reducing energy consumption in ammonia production processes, necessitate further research and development efforts. Overcoming these challenges requires comprehensive regulatory frameworks and policy incentives to incentivize investment in blue ammonia projects. While some jurisdictions have implemented carbon pricing mechanisms or renewable energy mandates, more targeted policies and financial incentives are needed to stimulate the growth of the blue ammonia sector.
Segmentation Analysis
By Technology:
The blue ammonia market can be segmented by technology into autothermal reforming (ATR) and the Haber-Bosch process. ATR involves a process where a combination of methane and steam undergoes reforming, leading to the production of hydrogen and carbon monoxide, which are then further reacted to produce ammonia. On the other hand, the Haber-Bosch Process is a traditional method where nitrogen and hydrogen are reacted under high pressure and temperature in the presence of an iron catalyst to produce ammonia.
By Manufacturing Process:
Segmentation by manufacturing process includes the thermochemical process, steam methane reforming (SMR), and electrochemical process. Thermochemical processes involve the reaction of natural gas or other hydrocarbons with air to produce synthesis gas, which is then converted to ammonia. SMR, a widely used method, involves the reaction of methane with steam to produce hydrogen, which is then reacted with nitrogen to produce ammonia. Electrochemical processes, emerging as a promising technology, involve the direct electrochemical reduction of nitrogen to produce ammonia.
By Application:
Segmentation by application includes fuel and energy storage. Within the fuel application segment, blue ammonia finds use in polymers, fertilizers, power generation, and pharmaceuticals. As a fuel, it offers a cleaner alternative to traditional fossil fuels, contributing to reduced emissions and environmental impact across diverse industries. In the energy storage application segment, blue ammonia is utilized for renewable energy integration and grid-scale energy storage, providing storage solutions for intermittent renewable energy sources and enhancing grid stability and reliability.
Segments:
By Technology:
- Autothermal Reforming (ATR)
- Haber-Bosch Process
By Manufacturing Process:
- Thermochemical Process
- Steam Methane Reforming (SMR)
- Electrochemical Process
By Distribution Channel:
- Distribution/Wholesalers
- E-commerce
- Direct Sale
By Application:
- Fuel
- Polymers
- Fertilizers
- Power Generation
- Pharmaceuticals
- Energy Storage
- Renewable energy integration
- Grid-scale energy storage
By End-Use:
- Power Generation
- Automotive
- Chemicals and Petrochemicals
- Pharmaceuticals
- Agriculture
By Region:
- North America
- The U.S.
- Canada
- Mexico
- Europe
- Germany
- France
- The U.K.
- Italy
- Spain
- Rest of Europe
- Asia Pacific
- China
- Japan
- India
- South Korea
- South-east Asia
- Rest of Asia Pacific
- Latin America
- Brazil
- Argentina
- Rest of Latin America
- Middle East & Africa
- GCC Countries
- South Africa
- Rest of the Middle East and Africa
Market Drivers
Rising Demand for Low-Carbon Fuels:
There’s a palpable global push to reduce greenhouse gas emissions and combat climate change, leading to a surge in demand for cleaner-burning fuels across diverse industries. For instance, global greenhouse gas emissions reached a new high of 53.8 billion metric tons of carbon dioxide equivalent (GtCO₂e) in 2022. This heightened awareness of environmental sustainability is propelling the adoption of blue ammonia as a promising solution. Its production from natural gas or fossil fuels with carbon capture and storage technology significantly mitigates emissions compared to conventional methods. As an example, carbon capture and storage (CCS) facilities worldwide currently account for just 0.12 percent of annual global emissions. As industries seek alternatives to traditional processes, blue ammonia emerges as a sustainable fuel option, aligning with stringent emission reduction targets and regulatory frameworks worldwide.
Hydrogen as a Clean Energy Carrier:
Hydrogen is increasingly recognized as a key player in the transition to a low-carbon economy, offering immense potential as a clean energy source. However, challenges associated with hydrogen storage and transportation impede its widespread adoption. In this context, ammonia serves as a convenient carrier for hydrogen, making blue ammonia an attractive option in the shift towards a hydrogen economy. Blue ammonia effectively addresses the logistical challenges of hydrogen transport while providing a scalable and efficient means of storing and delivering hydrogen to end-users across various sectors. For instance, clean hydrogen demand is projected to increase to between 125 and 585 Mtpa by 2050. Nearly all hydrogen consumed today is gray hydrogen (approximately 90 million tons per year [Mtpa]).
Decarbonization Efforts Across Sectors:
Industries such as fertilizer production, power generation, and transportation are actively seeking ways to lower their carbon footprint and meet sustainability targets. Blue ammonia emerges as a potential solution to decarbonize these sectors, offering a cleaner alternative to traditional, high-emission processes. In fertilizer production, for instance, blue ammonia can replace conventional ammonia derived from fossil fuels, reducing emissions throughout the supply chain. Similarly, in power generation and transportation, the adoption of blue ammonia as a fuel can significantly contribute to emissions reduction efforts, fostering a more sustainable energy landscape.
Focus on Sustainable Energy Solutions:
Governments and corporations worldwide are increasingly prioritizing investments in renewable energy sources and sustainable technologies as part of their long-term environmental strategies. Blue ammonia production, especially when coupled with carbon capture techniques, aligns perfectly with this focus on sustainability. By harnessing renewable energy sources such as wind or solar power to produce blue ammonia, stakeholders can further enhance its environmental credentials and contribute to the development of a circular economy. Moreover, the versatility of blue ammonia as a fuel, fertilizer, and chemical feedstock positions it as a cornerstone of sustainable energy solutions across various industries.
Strategic Collaborations and Targeted Investments:
Collaboration between industry players, research institutions, and government bodies is paramount for developing the necessary infrastructure and technology required for large-scale blue ammonia production and utilization. Strategic investments in research and development, coupled with targeted financial incentives and policy support, are driving market growth in specific regions. These collaborations foster innovation, knowledge sharing, and technology transfer, accelerating the commercialization and adoption of blue ammonia globally. Moreover, public-private partnerships play a crucial role in building the necessary regulatory frameworks and market mechanisms to support the sustainable growth of the blue ammonia sector, ensuring its long-term viability as a clean energy solution.
Market Trends
Technological Advancements in Carbon Capture:
Effective carbon capture and storage (CCS) technology is imperative for realizing the environmental benefits of blue ammonia. For instance, most carbon capture technologies aim to stop at least 90% of the CO2 in smokestacks from reaching the atmosphere. Advancements in CCS methods, particularly pre-combustion capture, play a crucial role in making blue ammonia a truly low-carbon solution. Pre-combustion capture is a technology that captures CO2 from a gas stream prior to combustion. However, as the technology approaches 100% efficiency, it gets more expensive and takes more energy to capture additional CO2. For instance, blue ammonia production currently relies heavily on fossil fuels. Global ammonia production today accounts for around 2% (8.6 EJ) of total final energy consumption. Just over 70% of ammonia production is via natural gas-based steam reforming, while most of the remainder is via coal gasification.
Development of Blue Ammonia Infrastructure:
The development of infrastructure for the production, transportation, and storage of blue ammonia is essential for its wider adoption across industries. For instance, the NuStar company has a pipeline system that transports approximately 1.5 million tons of anhydrous ammonia per year. This includes the establishment of dedicated pipelines, ammonia terminals, and conversion facilities for utilizing blue ammonia in various end-use applications.
Building robust infrastructure ensures the efficient and reliable supply of blue ammonia, facilitating its integration into existing energy systems and supply chains. The majority of this is directed towards increasing clean power capacities to 1,260 GW by 2050. Furthermore, the Argus company and DNV GL have partnered up to create the first database of ammonia terminals, which includes information on location, capacity, and ownership structure.
Shifting Regulations and Government Support:
Governments worldwide are actively developing policies and incentives to promote the adoption of low-carbon fuels like blue ammonia. Stringent emission regulations and carbon pricing mechanisms incentivize industries to transition towards cleaner energy sources. Government support, in the form of subsidies, grants, and tax incentives, encourages investment in blue ammonia production and infrastructure development, thereby accelerating market growth and fostering a conducive regulatory environment.
Exploration of Alternative Production Pathways:
While blue ammonia production currently relies on natural gas, ongoing research explores alternative methods using renewable energy sources, such as solar or wind power, for hydrogen production. This innovation holds the potential to produce "green ammonia" with an even lower carbon footprint, further enhancing the environmental credentials of ammonia-based fuels. Exploring alternative production pathways aligns with the growing focus on sustainability and renewable energy integration, driving innovation and diversification in the blue ammonia market.
Focus on cost reduction and scalability:
To gain wider acceptance and competitiveness in the market, blue ammonia production must undergo cost reduction and scalability improvements. Scaling up production facilities and optimizing production processes are crucial steps towards achieving cost parity with traditional fuels. Streamlining operations, leveraging economies of scale, and investing in research and development initiatives aimed at efficiency enhancement contribute to making blue ammonia a cost-effective and commercially viable energy solution.
Regional Variations in Market Adoption:
The adoption of blue ammonia varies regionally, influenced by factors such as government support, existing infrastructure for ammonia production, and the demand for clean energy solutions. Regions with strong government policies promoting renewable energy and low-carbon fuels are expected to see early adoption of blue ammonia. Additionally, areas with established infrastructure for ammonia production and distribution may experience faster market penetration. Understanding these regional variations is essential for stakeholders to navigate market dynamics and capitalize on emerging opportunities in the blue ammonia sector.
Market Restraints and Challenges
High Production Cost:
Currently, blue ammonia production entails higher costs compared to traditional gray ammonia, primarily due to the additional expense of carbon capture and storage (CCS) technology. This elevated production cost renders blue ammonia less economically viable, particularly for price-sensitive industries. The need to balance environmental benefits with cost considerations poses a significant challenge, impeding widespread adoption and market growth in the short term.
Lack of established infrastructure:
The absence of well-established infrastructure for the large-scale transportation, storage, and utilization of blue ammonia presents a considerable hurdle to its broader market penetration. The development of dedicated pipelines, storage facilities, and conversion plants is essential to ensuring the efficient and reliable supply of blue ammonia. Overcoming this infrastructure gap requires significant investment and collaborative efforts from industry stakeholders, prolonging the timeline for market expansion and commercialization.
Uncertainty Around Life-Cycle Carbon Footprint:
While carbon capture and storage (CCS) technology plays a crucial role in reducing emissions during blue ammonia production, uncertainties persist regarding its entire life cycle carbon footprint. Methane emissions during natural gas extraction and potential leakage during CCS operations can impact the overall environmental sustainability of blue ammonia. Addressing these uncertainties and conducting comprehensive life-cycle assessments are essential to accurately quantifying the environmental benefits of blue ammonia and mitigating potential risks associated with its production and utilization.
Limited Public Awareness and Regulations:
Public awareness about blue ammonia and its environmental benefits remains relatively low, posing a challenge to market adoption and consumer acceptance. Similarly, the absence of clear and standardized regulations governing its production, transportation, and use further complicates market dynamics. Establishing robust regulatory frameworks and raising public awareness through education and outreach initiatives are essential steps to foster market confidence and facilitate the uptake of blue ammonia as a sustainable energy solution.
Competition from Alternative Clean Energy Solutions:
Blue ammonia faces stiff competition from other emerging clean energy sources, such as green hydrogen and biofuels. The relative cost-effectiveness, scalability, and environmental performance of these alternatives directly impact Blue Ammonia's market share and growth prospects. As the renewable energy landscape evolves, identifying opportunities for synergies and differentiation becomes crucial for positioning blue ammonia as a competitive and sustainable energy solution in the global market.
Key Players
- Yara International (Norway)
- Saudi Arabian Oil Co. (Saudi Arabia)
- OCI (UK)
- CF Industries Holdings, Inc. (US)
- QATAR FERTILISER COMPANY (QAFCO) (Qatar)
- Ma’aden (Saudi Arabia)
- Shell (England)
- ExxonMobil Corporation (US)
- LSB Industries (US)
- ITOCHU Corporation (Japan)
- Técnicas Reunidas S. A. (Spain)
- PAO NOVATEK (Russia)
- ADNOC Group (UAE)
- Linde plc (Ireland)
- Equinor ASA (Norway)
- EuroChem Group (Switzerland)
- Uniper SE (Germany)
- Hydrofuel Canada Inc. (Canada)
- Dastur Energy (US)
- Nutrien Ltd. (Canada)
Recent Developments
In June 2023, Yara International ASA and BASF forged a strategic alliance aimed at the establishment and construction of a large-scale, low-carbon blue ammonia production plant with carbon capture in the Gulf Coast region of the United States. This collaboration stems from the escalating global demand for low-carbon ammonia solutions. The envisioned facility is anticipated to boast an overall production capacity ranging from 1.2 to 1.4 million tons per year, signifying a substantial commitment to meeting the growing need for sustainable ammonia production.
In April 2023, Saudi Aramco orchestrated a collaborative effort involving various stakeholders across the low-carbon ammonia value chain, culminating in the successful delivery of the inaugural consignment of blue ammonia to Japan. SABIC Agri-Nutrients leveraged Aramco's feedstock to produce the ammonia, which was subsequently procured by Fuji Oil Company through Aramco Trading Company. Mitsui O.S.K. Lines undertook the responsibility for the transportation of the liquid to Japan, where the ammonia was seamlessly transferred. This milestone underscores the concerted efforts of industry players to actualize the vision of a global blue ammonia market.
In March 2023, Linde plc, a globally recognized provider of industrial gases and engineering solutions, inked a significant long-term agreement with OCI, a leading manufacturer and supplier of hydrogen-based products. This landmark arrangement entails Linde's commitment to supplying clean hydrogen and nitrogen to OCI's forthcoming blue ammonia facility, currently in the developmental stages in Texas, USA. This collaboration underscores the strategic alignment between Linde and OCI in championing sustainable practices and fostering the proliferation of low-carbon ammonia solutions in the United States and beyond.
Regional Analysis
North America
The North American blue ammonia market has emerged as a frontrunner in the global landscape. The region accounted for the largest market share in 2023, standing at 35%. This dominance can be attributed to the robust research and development activities as well as the strong policy support from governments in the United States and Canada. Moreover, the region's well-established industrial infrastructure and the presence of major players in the blue ammonia industry have further bolstered the market's growth.
Europe
Europe is another prominent player in the blue ammonia market, with a market share of 30% in 2023. The region's commitment to reducing greenhouse gas emissions and transitioning towards sustainable energy sources has been a key driver for the blue ammonia market. Countries such as Germany, the United Kingdom, and the Netherlands have been at the forefront of this transition, investing heavily in the development of blue ammonia production facilities and supporting infrastructure.
Asia-Pacific
The Asia-Pacific region is poised to witness significant growth in the blue ammonia market, with a market share of 25% in 2023. The region's rapidly growing energy demand, coupled with the need to address environmental concerns, has fueled the adoption of blue ammonia as a viable alternative to traditional energy sources. Countries like China, Japan, and South Korea have been actively investing in the development of blue ammonia production and distribution networks, positioning the region as a key player in the global blue ammonia market.
Future Outlook
- The blue ammonia market is poised for significant growth driven by escalating global demand for low-carbon fuels and chemicals.
- Technological advancements in carbon capture and storage (CCS) are expected to further enhance the environmental credentials of blue ammonia, bolstering its adoption.
- Continued investments in infrastructure development, including production facilities and transportation networks, will facilitate broader market penetration.
- Regulatory support and policy incentives aimed at promoting sustainable energy solutions will play a pivotal role in shaping the market landscape.
- Collaborative efforts among industry players, governments, and research institutions will drive innovation and accelerate market development.
- Growing awareness among consumers and businesses about the environmental benefits of blue ammonia will fuel demand across various sectors.
- The exploration of alternative production pathways, such as green ammonia production using renewable energy sources, holds promise for further reducing carbon emissions.
- Strategic partnerships and alliances, both domestically and internationally, will enable market participants to leverage synergies and expand their market reach.
- Enhanced focus on cost reduction and scalability will make blue ammonia more competitive with traditional fuels, driving its widespread adoption.
- Regional variations in market dynamics will continue to influence market growth, with early adopters benefiting from supportive regulatory frameworks and existing infrastructure.
Request a Free Sample
Fill in your details and we'll send you a free sample report.
- Sample data tables & charts
- Research methodology
Need a Custom Version of This Report?
Tailor the scope, geography, or segments to your exact requirements.
- Custom geography or segment scope
- Direct access to our analyst team
Frequently Asked Questions
What is the projected growth of the blue ammonia market between 2023 and 2032?
What factors are driving the growth of the blue ammonia market?
Who are the major players in the blue ammonia market?
How is the availability of Blue Ammonia Market expanding, and through what channels?
Table of Content
Chapter 1. Report Introduction
- 1.1 Report Description & Purpose
- 1.1.1 Report Title & Market Definition
- 1.1.2 Unique Selling Propositions (USP) & Key Differentiators
- 1.1.3 Value Proposition for Stakeholders
- 1.2 Research Objectives
- 1.2.1 Market Sizing Objectives (Volume & Revenue) (Volume Where Applicable)
- 1.2.2 Segmentation Objectives
- 1.2.3 Competitive Intelligence Objectives
- 1.2.4 Forecast & Scenario Objectives
- 1.3 Report Scope
- 1.3.1 Blue Ammonia Scope – Segments & Subsegments Covered
- 1.3.2 Geographic Scope – Regions & Countries Covered
- 1.3.3 Historical Period, Base Year & Forecast Period (2023; forecast to 2032)
- 1.3.4 Inclusions & Exclusions
- 1.4 Industry Classification & Applicable Codes
- 1.5 Currency, Measurement Units & Valuation Basis
- 1.6 Target Stakeholders
- 1.7 Limitations & Assumptions
Chapter 2. Executive Summary
- 2.1 Global Blue Ammonia Market Snapshot
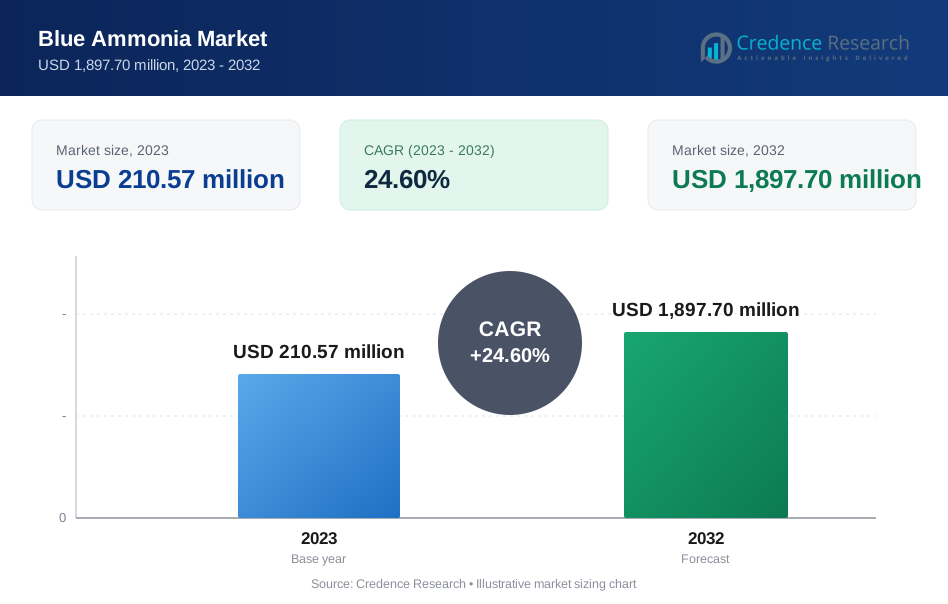
- 2.1.1 Market Size – Historical (2023) & Forecast (2023-2032) (2023: USD 210.57 million → 2032: USD 1,897.70 million)
- 2.1.2 Volume & Revenue – Global Totals (Volume Where Applicable)
- 2.1.3 Key Market Highlights – Top Five Facts
- 2.2 Blue Ammonia Market Segmentation Snapshot
- 2.2.1 Market Split by Region – 2023 vs. 2032
- 2.3 Competitive Snapshot
- 2.3.1 Top 10 Players by Revenue Share – 2023
- 2.3.2 Top 10 Players by Volume Share – 2023 (Volume Where Applicable)
- 2.3.3 Recent Strategic Developments (18-Month Summary)
- 2.4 Key Investment Highlights & Strategic Conclusions
Chapter 3. Blue Ammonia Market Dynamics & Industry Analysis
- 3.1 Market Overview & Context
- 3.1.1 Blue Ammonia Market Position in the Broader Industry Value Chain
- 3.1.2 Demand Structure & Purchasing Dynamics
- 3.1.3 Market Maturity & Development Stage by Region
- 3.2 Blue Ammonia Market Drivers
- 3.3 Blue Ammonia Market Restraints & Challenges
- 3.4 Blue Ammonia Market Opportunities
- 3.5 Porter's Five Forces Analysis
- 3.5.1 Threat of New Entrants
- 3.5.2 Bargaining Power of Suppliers
- 3.5.3 Bargaining Power of Buyers
- 3.5.4 Threat of Substitutes
- 3.5.5 Competitive Rivalry – Intensity Assessment
- 3.6 Blue Ammonia Value Chain Analysis
- 3.6.1 Upstream – Key Inputs, Resources & Suppliers
- 3.6.1.1 Key Input/Resource 1
- 3.6.1.2 Key Input/Resource 2
- 3.6.1.3 Key Input/Resource 3
- 3.6.2 Midstream – Core Operations & Value Creation
- 3.6.2.1 Operating Model & Process Overview
- 3.6.2.2 Key Operating Locations & Capabilities by Company
- 3.6.3 Downstream – Market Channels & End Users
- 3.6.3.1 Direct Sales & Customer Engagement Channels
- 3.6.3.2 Indirect Sales, Intermediaries & Partner Channels
- 3.6.4 Value Chain Profitability Analysis
- 3.6.1 Upstream – Key Inputs, Resources & Suppliers
- 3.7 PESTEL Analysis
- 3.7.1 Political Factors
- 3.7.2 Economic Factors
- 3.7.3 Social Factors
- 3.7.4 Technological Factors
- 3.7.5 Environmental Factors
- 3.7.6 Legal Factors
- 3.8 Blue Ammonia Supply Chain Analysis
- 3.8.1 Critical Input & Resource Availability Risk Assessment
- 3.8.2 Supplier & Operational Concentration Risk (Geographic Exposure)
- 3.8.3 Supply & Service Disruption Impact Analysis
- 3.9 Regulatory & Policy Landscape
Note: The regulatory and policy landscape section covers regulations based on their applicability to the market, Blue Ammonia category, geography, and scope of the study. Only regulatory frameworks with a material impact on operations, compliance, trade, sustainability, or market access are analyzed in detail.
Chapter 4. Key Investment Pockets & Opportunity Analysis
- 4.1 Blue Ammonia Market Attractiveness Analysis
- 4.1.1 By Region – Investment Attractiveness Matrix (Market Size × CAGR)
- 4.2 Absolute Revenue Growth Opportunity
- 4.2.1 By Region – Absolute Revenue Growth Through 2032
- 4.3 Incremental Demand Opportunity
- 4.3.1 By Region – Incremental Demand Through 2032
- 4.3.2 Segment – Incremental Demand
- 4.4 Emerging Submarket Opportunity Deep Dive (Subject to Applicability)
- 4.5 Priority Market Opportunity Scorecards
- 4.5.1 United States
- 4.5.2 Europe
- 4.5.3 Asia
- 4.5.4 Middle East & Africa
Note: Priority market opportunity scorecards reflect the geographic scope and strategic relevance of the study. Listed markets are indicative and may be adapted to the industry.
Chapter 5. Blue Ammonia Cross-Border Trade & Market Access Analysis
- 5.1 International Trade & Cross-Border Activity Overview
- 5.1.1 Global Export Value by Country (2023)
- 5.1.2 Global Export Volume by Country (2023) (Volume Where Applicable)
- 5.1.3 Global Import Value by Country (2023)
- 5.1.4 Global Import Volume by Country (2023) (Volume Where Applicable)
- 5.1.5 Net Trade Balance by Country (2023)
- 5.2 Export Analysis – Segment
- 5.2.1 Category 1 (Applicable Classification Code)
- 5.2.2 Category 2 (Applicable Classification Code)
- 5.2.3 Category 3 (Applicable Classification Code)
- 5.2.4 Category 4 (Applicable Classification Code)
- 5.2.5 Category 5 (Applicable Classification Code)
- 5.3 Import Analysis – Segment
- 5.3.1 Category 1 (Applicable Classification Code)
- 5.3.2 Category 2 (Applicable Classification Code)
- 5.3.3 Category 3 (Applicable Classification Code)
- 5.3.4 Category 4 (Applicable Classification Code)
- 5.3.5 Category 5 (Applicable Classification Code)
- 5.4 Cross-Border Pricing & Transaction Benchmarks
- 5.4.1 Export Pricing – Segment & Country
- 5.4.2 Import Pricing – Segment & Source Country
- 5.4.3 Price Trends (2023)
- 5.5 Key Cross-Border Trade & Delivery Routes
- 5.5.1 Cross-Border Trade/Delivery Route 1
- 5.5.2 Cross-Border Trade/Delivery Route 2
- 5.5.3 Cross-Border Trade/Delivery Route 3
- 5.5.4 Cross-Border Trade/Delivery Route 4
- 5.5.5 Cross-Border Trade/Delivery Route 5
- 5.6 Trade Policy & Market Access Impact Assessment
- 5.6.1 Tariff & Non-Tariff Barriers
- 5.6.2 Regional Trade & Economic Integration Frameworks
- 5.6.3 Bilateral & Multilateral Trade Agreements
- 5.6.4 Cross-Border Operating, Licensing & Localization Requirements
Note: This chapter applies where cross-border trade or delivery is relevant to Blue Ammonia. Goods, services, and digital offerings are assessed using applicable classifications and transaction measures. Import-export volumes, trade balances, and route analyses are included only where meaningful to the market.
Chapter 6. Competitive Landscape & Company Benchmarking
- 6.1 Blue Ammonia Market Concentration & Structure
- 6.1.1 Herfindahl-Hirschman Index (HHI) – vs. 2023
- 6.1.2 Leading, Mid-Sized & Emerging Player Structure
- 6.1.3 Global, Regional & Local Player Dynamics
- 6.2 Blue Ammonia Market Share Analysis – 2023
- 6.2.1 Global Revenue Share by Company
- 6.2.2 Global Volume Share by Company (Volume Where Applicable)
- 6.2.3 Regional Revenue Share
- 6.2.4 Market Share Evolution ( vs. 2023)
- 6.2.5 Company Market Share by Key Segment
- 6.2.6 Company Market Share by Customer Group
- 6.3 Operating Scale, Capacity & Infrastructure Analysis
- 6.3.1 Global Operating Scale & Supply Capacity
- 6.3.2 Resource Utilization & Operating Efficiency
- 6.3.3 Output, Service Delivery & Activity Metrics
- 6.3.4 Operating Footprint & Infrastructure Map
- 6.3.5 Planned Operational & Capacity Expansion
- 6.4 Blue Ammonia Competitive Benchmarking Matrix
- 6.4.1 Revenue, Growth, Profitability & Operating Metric Comparison
- 6.4.2 Channel Revenue Mix
- 6.4.3 Geographic Revenue Exposure
- 6.4.4 R&D Intensity
- 6.4.5 Sustainability Maturity
- 6.5 Strategic Developments in Blue Ammonia (Last 24 Months)
- 6.5.1 Mergers, Acquisitions & Divestments
- 6.5.2 New Products, Services & Solutions in Blue Ammonia
- 6.5.3 Operational & Infrastructure Expansions
- 6.5.4 Strategic Alliances, Joint Ventures & Partnerships
- 6.5.5 Distribution Expansion & Market Entry
- 6.5.6 Sustainability & ESG Initiatives
- 6.6 Competitive Strategy Mapping
- 6.6.1 Leader, Challenger, Follower & Niche Classification
- 6.6.2 Pricing Strategy Comparison
- 6.6.3 Channel Strategy Matrix
Note: Strategic developments are included based on their materiality and the availability of reliable information.
Chapter 7. Global Blue Ammonia Market – By Sales & Delivery Channel
- 7.1 Segment Overview
- 7.1.1 Volume & Revenue Split by Channel (2023 & 2032) (Volume Where Applicable)
- 7.1.2 Channel Mix Evolution (2023-2032)
Chapter 8. Regional Market Analysis – Global Overview
- 8.1 Global Regional Overview
- 8.1.1 Regional Volume Share (Volume Where Applicable)
- 8.1.2 Regional Revenue Share
- 8.1.3 Regional Volume by Region (Volume Where Applicable)
- 8.1.4 Regional Revenue by Region
- 8.1.5 Regional Forecast Through 2032
- 8.2 Cross-Regional Segment Analysis
- 8.2.1 By Sales & Delivery Channel
- 8.2.2 By Competitive Positioning & Price Tier
Chapter 9. North America Blue Ammonia Market
- 9.1 United States
- 9.2 Canada
- 9.3 Mexico
Chapter 10. Europe Blue Ammonia Market
- 10.1 Germany
- 10.2 France
- 10.3 Italy
- 10.4 United Kingdom
- 10.5 Spain
- 10.6 Poland
- 10.7 Russia
- 10.8 Netherlands
- 10.9 Belgium
- 10.10 Sweden
- 10.11 Denmark
- 10.12 Norway
- 10.13 Rest of Europe
Chapter 11. Asia Pacific Blue Ammonia Market
- 11.1 China
- 11.2 India
- 11.3 Japan
- 11.4 South Korea
- 11.5 Thailand
- 11.6 Indonesia
- 11.7 Vietnam
- 11.8 Malaysia
- 11.9 Australia
- 11.10 Rest of Asia Pacific
Chapter 12. Latin America Blue Ammonia Market
- 12.1 Brazil
- 12.2 Argentina
- 12.3 Colombia
- 12.4 Chile
- 12.5 Rest of Latin America
Chapter 13. Middle East Blue Ammonia Market
- 13.1 Saudi Arabia
- 13.2 United Arab Emirates
- 13.3 Turkey
- 13.4 Israel
- 13.5 Iran
- 13.6 Rest of the Middle East
Chapter 14. Africa Blue Ammonia Market
- 14.1 South Africa
- 14.2 Egypt
- 14.3 Nigeria
- 14.4 Morocco
- 14.5 Rest of Africa
Chapter 15. Blue Ammonia Company Profiles
- 15.1 [Company 01]
- 15.1.1 Company Overview
- 15.1.2 Key Management Personnel
- 15.1.3 Products & Services Portfolio
- 15.1.4 Financial Performance
- 15.1.5 Key Market Focus & Geographic Presence
- 15.1.6 Recent Developments & Strategic Initiatives
Note: The company profile list is preliminary and may change based on research findings, market developments, data availability, and client requirements.
Chapter 16. Appendices
- Appendix A – List of Abbreviations & Acronyms
- Appendix B – Industry Classification Code Reference – Full Series
- Appendix C – Supply, Output & Operating Capacity Data Tables
- Appendix D – End-Use & Demand Base Tables
- Appendix E – Demand, Adoption & Usage Assumptions
- Appendix F – Pricing & Revenue Metric Reference Tables
- Appendix G – Company Operations & Infrastructure Database
- Appendix H – Cross-Border Trade & Activity Data Tables (Where Applicable)
- Appendix I – Regulatory Summary Tables
- Appendix J – Primary Research Participant List (Anonymized)
- Appendix K – Primary Research Questionnaire Framework
- Appendix L – Data Sources & Bibliography
- Appendix M – Market Size Divergence & Source Comparison
Chapter 17. Research Methodology
- 17.1 Research Framework & Philosophy
- 17.2 Secondary Research – Sources, Hierarchy & Data Extraction
- 17.3 Data Modeling – Bottom-Up & Top-Down Market Sizing
- 17.4 Primary Research – Stakeholder Framework, LOI & Sample Sizes
- 17.5 Forecast Methodology – Regression, Scenario & Sensitivity Analysis
- 17.6 Quality Control – Four-Layer Validation Framework
- 17.7 Limitations & Standard Assumptions
- 17.8 Disclaimer
